Copyright
©The Author(s) 2015.
World J Orthop. Mar 18, 2015; 6(2): 190-201
Published online Mar 18, 2015. doi: 10.5312/wjo.v6.i2.190
Published online Mar 18, 2015. doi: 10.5312/wjo.v6.i2.190
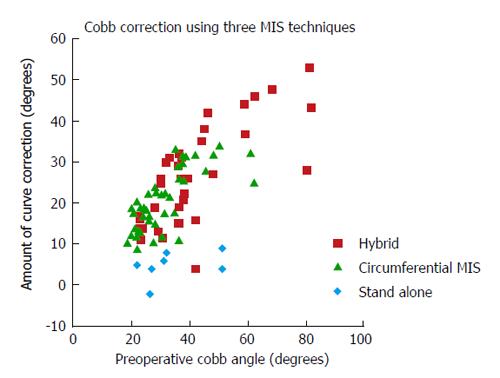
Figure 3 Scatterplot depicting scoliotic curve correction achieved at last follow-up as a function of peroperative curve severity.
- Citation: Hofstetter CP, Hofer AS, Wang MY. Economic impact of minimally invasive lumbar surgery. World J Orthop 2015; 6(2): 190-201
- URL: https://www.wjgnet.com/2218-5836/full/v6/i2/190.htm
- DOI: https://dx.doi.org/10.5312/wjo.v6.i2.190


