
















Copyright: ©Author(s) 2026.
World J Orthop. May 18, 2026; 17(5): 118547
Published online May 18, 2026. doi: 10.5312/wjo.v17.i5.118547
Published online May 18, 2026. doi: 10.5312/wjo.v17.i5.118547
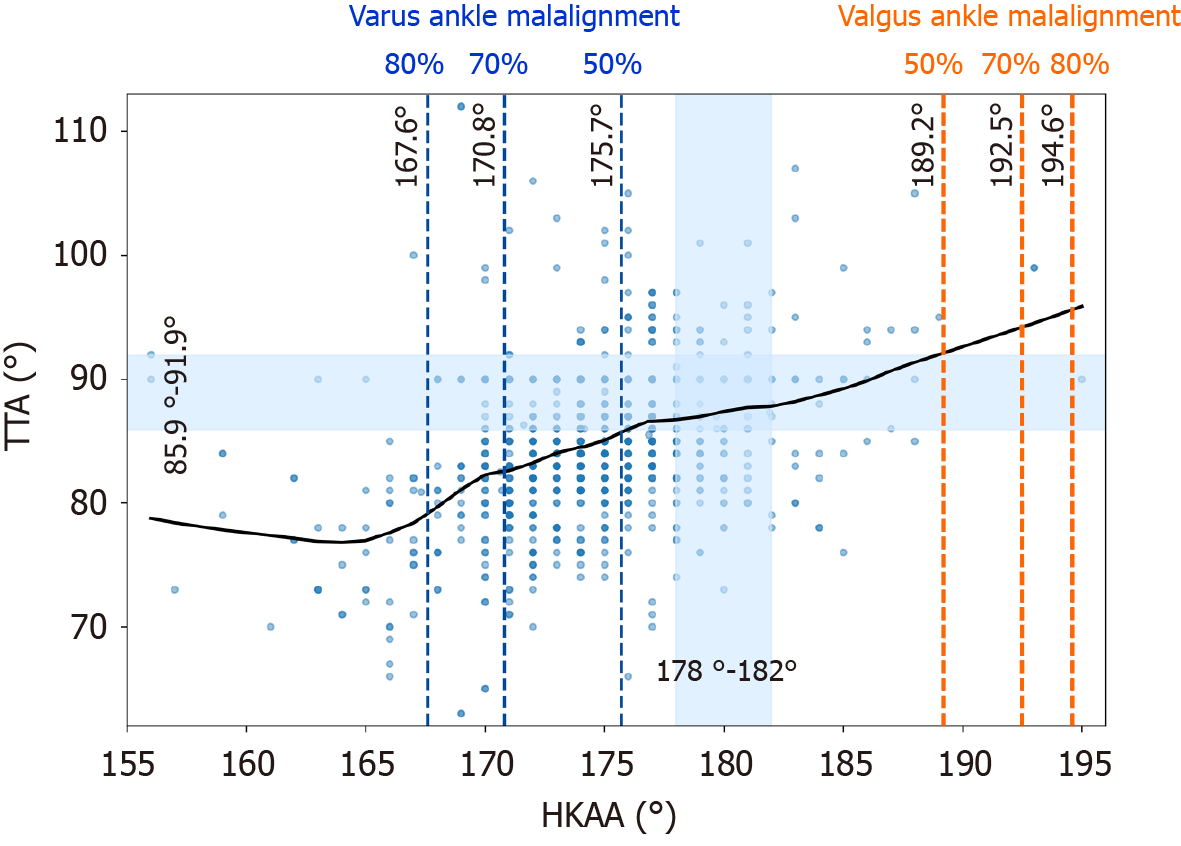
Figure 3 Scatterplot showing the relationship between hip to knee to ankle angle and tibiotalar angle with locally weighted scatterplot smoothing.
Blue dashed vertical lines indicate hip to knee to ankle angle (HKAA) thresholds corresponding to 50%, 70%, and 80% predicted probabilities of varus ankle malalignment [tibiotalar angle (TTA)< 85.9°], while red dashed lines indicate corresponding thresholds for valgus ankle malalignment (TTA > 91.9°), derived from direction-specific logistic regression models. Shaded regions represent neutral knee HKAA (178°-182°) and ankle neutral TTA (85.9°-91.9°) alignment ranges. HKAA: Hip to knee to ankle angle; TTA: Tibiotalar angle.
- Citation: Khalifa AA, Lemma S, Fadle AA. In knee osteoarthritis, what is the knee deformity threshold after which the ankle realigns beyond the neutral zone? World J Orthop 2026; 17(5): 118547
- URL: https://www.wjgnet.com/2218-5836/full/v17/i5/118547.htm
- DOI: https://dx.doi.org/10.5312/wjo.v17.i5.118547