
















Copyright: ©Author(s) 2026.
World J Orthop. May 18, 2026; 17(5): 118547
Published online May 18, 2026. doi: 10.5312/wjo.v17.i5.118547
Published online May 18, 2026. doi: 10.5312/wjo.v17.i5.118547
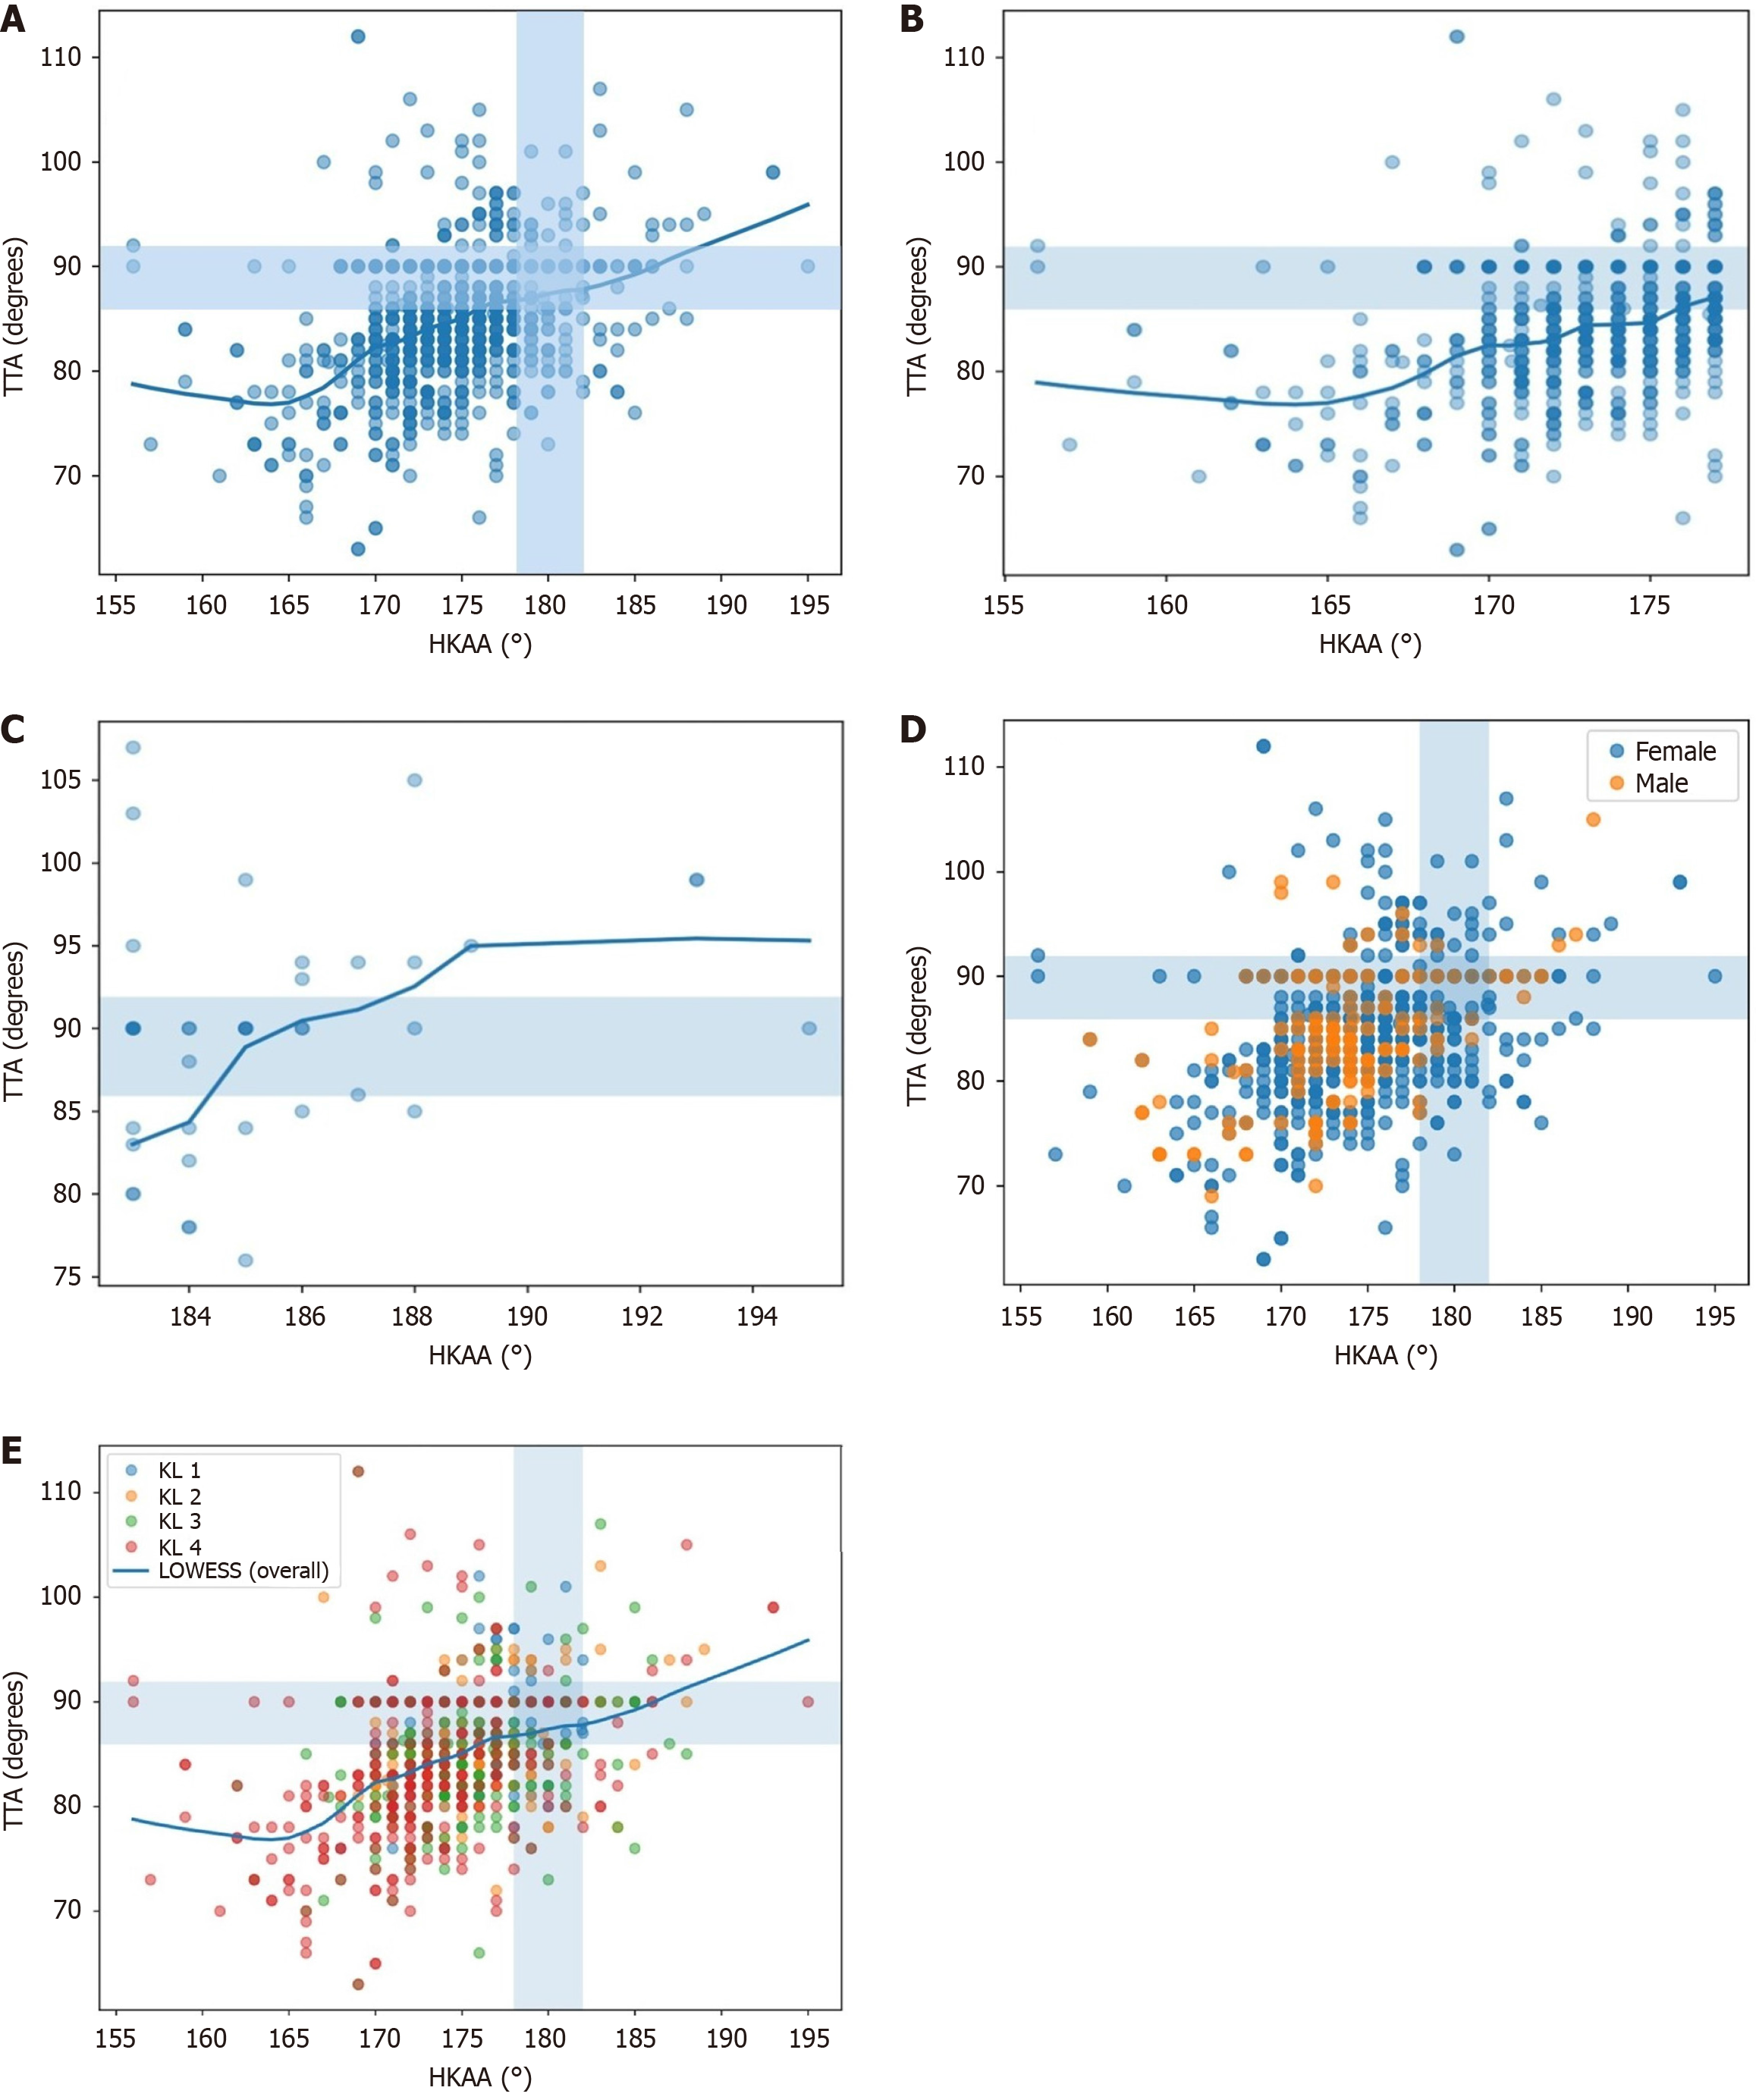
Figure 2 Scatter plots illustrating the relationship between the hip to knee to ankle angle and the tibiotalar angle with shaded neutral zones (hip to knee to ankle angle: 178-182°, tibiotalar angle: 85.
9-91.9°). A: All the patients; B: Varus knees; C: Valgus knees; D: Stratified based on patients’ sex; E: Stratified based on the knee osteoarthritis Kellgren-Lawrence grades. The solid curve represents locally weighted scatterplot smoothing, used to explore non-linear trends without assuming a predefined functional form. A steeper and more consistent trend is observed in varus knees, whereas greater dispersion is seen in valgus knees. HKAA: Hip to knee to ankle angle; TTA: Tibiotalar angle; KL: Kellgren-Lawrence; LOWESS: Locally weighted scatterplot smoothing.
- Citation: Khalifa AA, Lemma S, Fadle AA. In knee osteoarthritis, what is the knee deformity threshold after which the ankle realigns beyond the neutral zone? World J Orthop 2026; 17(5): 118547
- URL: https://www.wjgnet.com/2218-5836/full/v17/i5/118547.htm
- DOI: https://dx.doi.org/10.5312/wjo.v17.i5.118547