
















Copyright: ©Author(s) 2026.
World J Orthop. May 18, 2026; 17(5): 116330
Published online May 18, 2026. doi: 10.5312/wjo.v17.i5.116330
Published online May 18, 2026. doi: 10.5312/wjo.v17.i5.116330
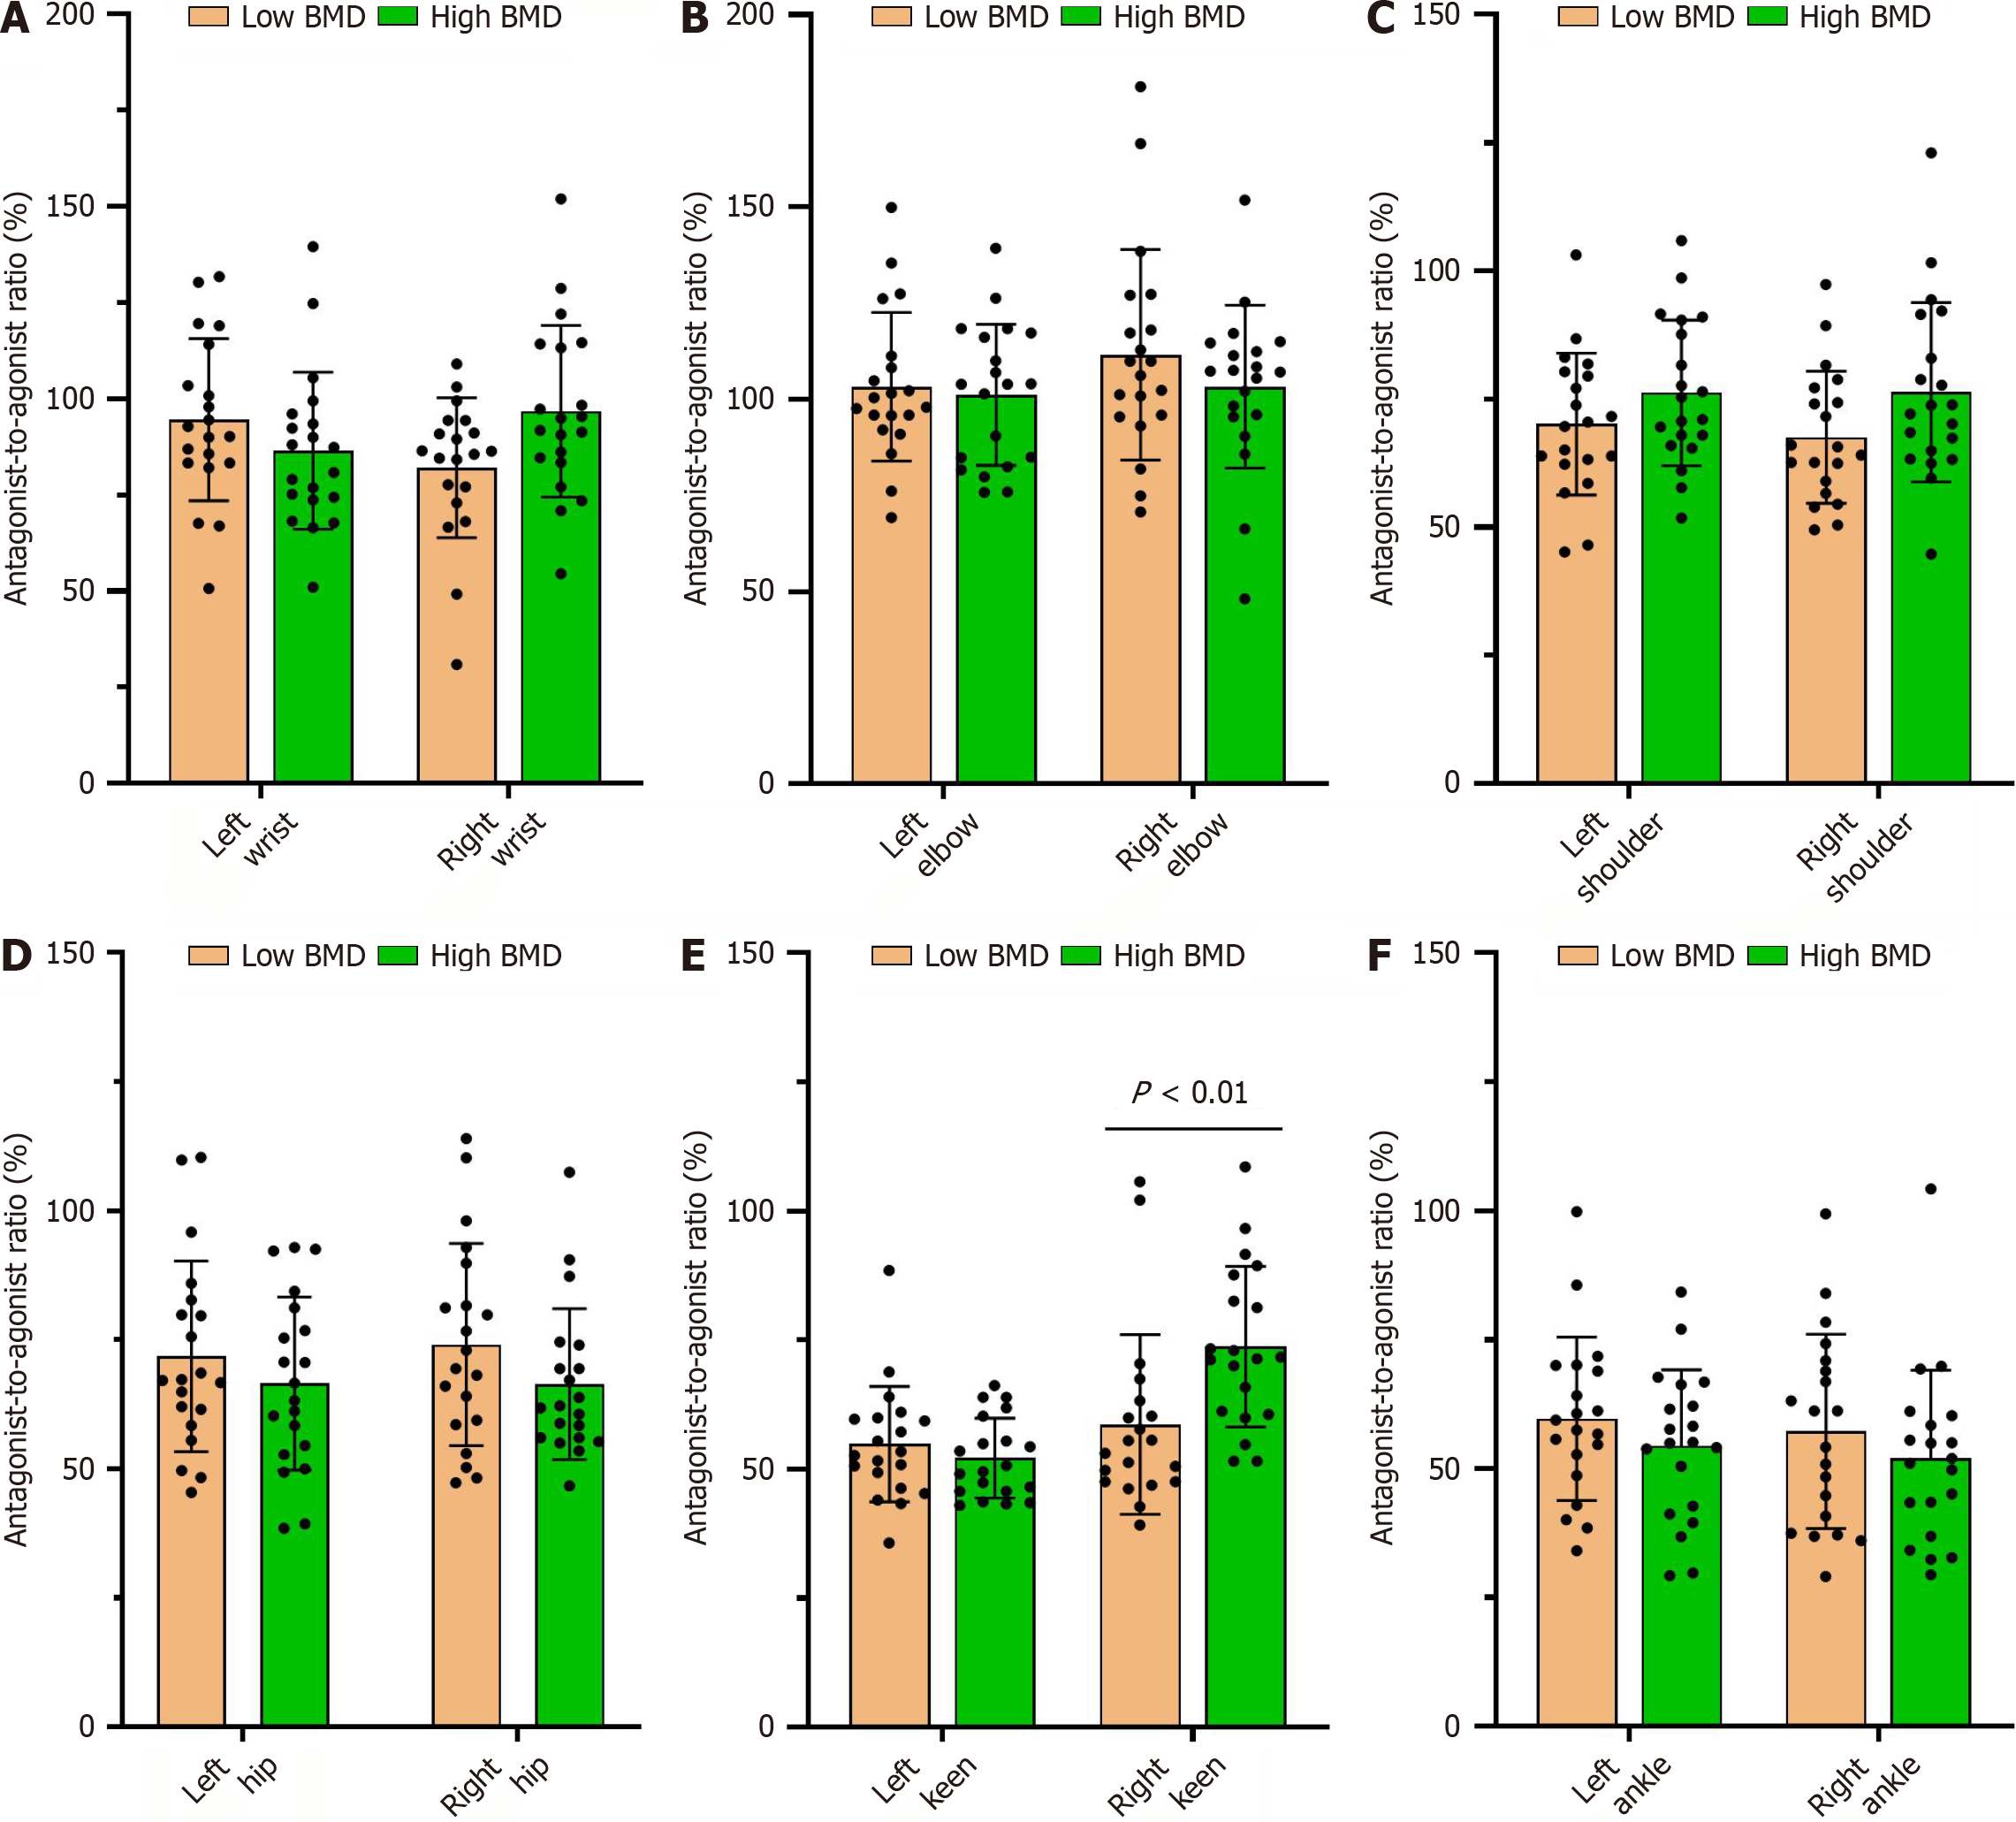
Figure 8 Results of the absolute peak torque ratio of active muscle to antagonist muscle in each joint.
A: Absolute peak torque ratio of the agonist to antagonist of the wrist; B: Absolute peak torque ratio of the agonist to antagonist of the elbow; C: Absolute peak torque ratio of the agonist to antagonist of the shoulder; D: Absolute peak torque ratio of hip agonist to antagonist; E: Absolute peak torque ratio of agonist to antagonist of the knee; F: Absolute peak torque ratio of ankle agonist to antagonist muscle. BMD: Bone mineral density.
- Citation: Feng Y, Liu SN, Xu SJ, Feng YZ, Yu HP, Zheng RL, Wei JX, Sun QH, Zhong Y, Ma JZ. Musculoskeletal and bone health characteristics in young men: A comparison of low and high bone mineral density. World J Orthop 2026; 17(5): 116330
- URL: https://www.wjgnet.com/2218-5836/full/v17/i5/116330.htm
- DOI: https://dx.doi.org/10.5312/wjo.v17.i5.116330