
















©The Author(s) 2026.
World J Orthop. Feb 18, 2026; 17(2): 115615
Published online Feb 18, 2026. doi: 10.5312/wjo.v17.i2.115615
Published online Feb 18, 2026. doi: 10.5312/wjo.v17.i2.115615
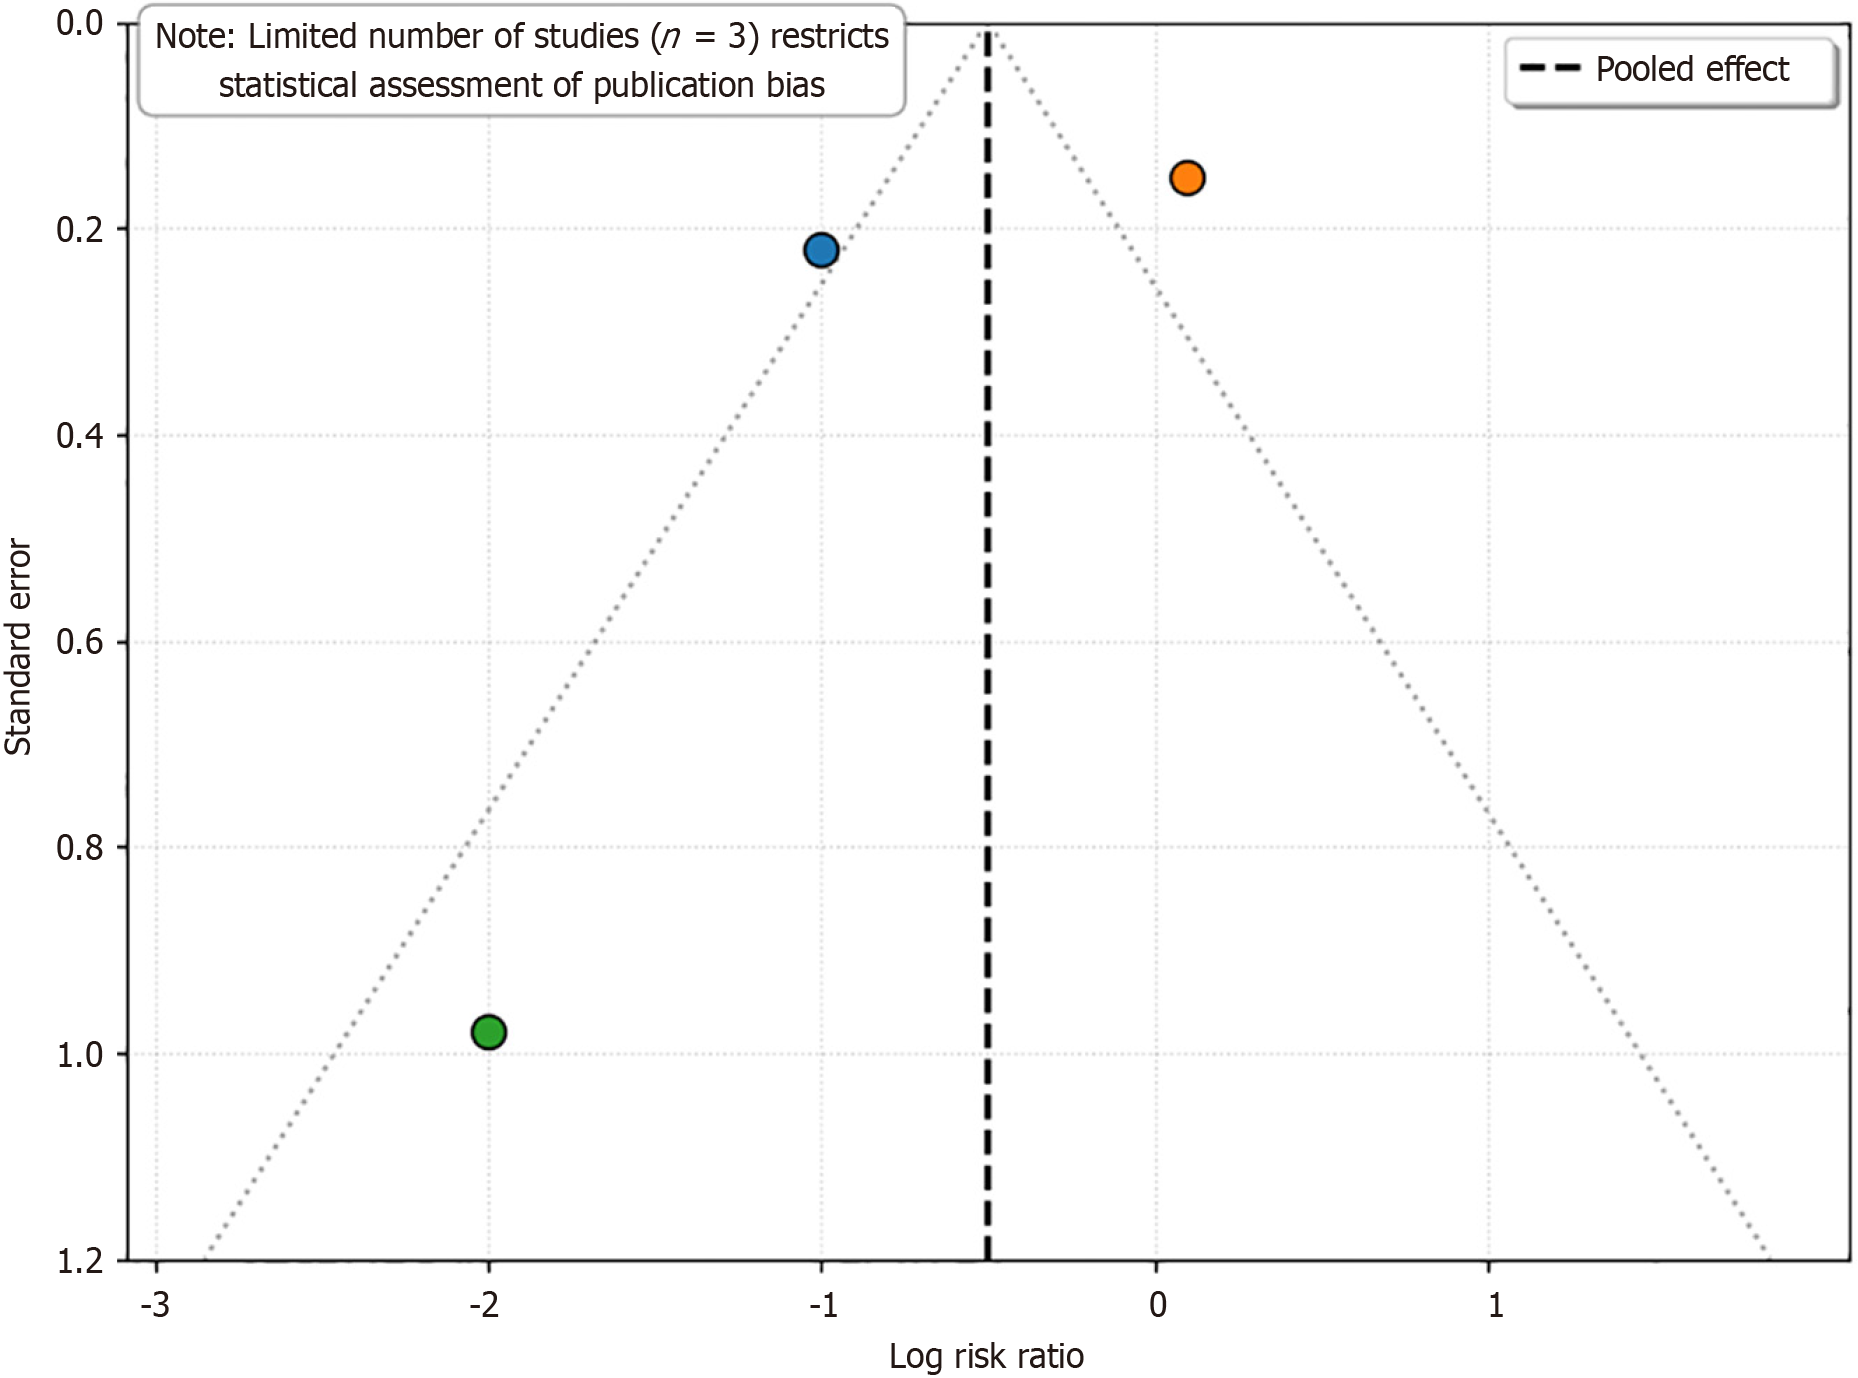
Figure 3 Funnel plot for visual assessment of publication bias for periprosthetic femoral fracture incidence.
The plot displays the log risk ratio (log risk ratio) on the X-axis vs the standard error on the Y-axis for each included study. The vertical solid line represents the pooled effect estimate, and the diagonal dashed lines represent the 95% confidence interval limits around the pooled estimate. In the absence of publication bias and heterogeneity, studies should be distributed symmetrically around the pooled estimate in an inverted funnel shape. Asymmetry may suggest publication bias, although interpretation is severely limited by the small number of included studies (n = 3). Egger’s regression test was not statistically significant (P = 0.42), suggesting no strong evidence of publication bias, although statistical power is low with this number of studies.
- Citation: Abushal MH, Embaby OM, Mersal M, Badghish E, Elalfy M. Cemented vs uncemented femoral fixation in total hip arthroplasty: A systematic review and meta-analysis of periprosthetic fracture risk. World J Orthop 2026; 17(2): 115615
- URL: https://www.wjgnet.com/2218-5836/full/v17/i2/115615.htm
- DOI: https://dx.doi.org/10.5312/wjo.v17.i2.115615