
















©The Author(s) 2026.
World J Orthop. Feb 18, 2026; 17(2): 115615
Published online Feb 18, 2026. doi: 10.5312/wjo.v17.i2.115615
Published online Feb 18, 2026. doi: 10.5312/wjo.v17.i2.115615
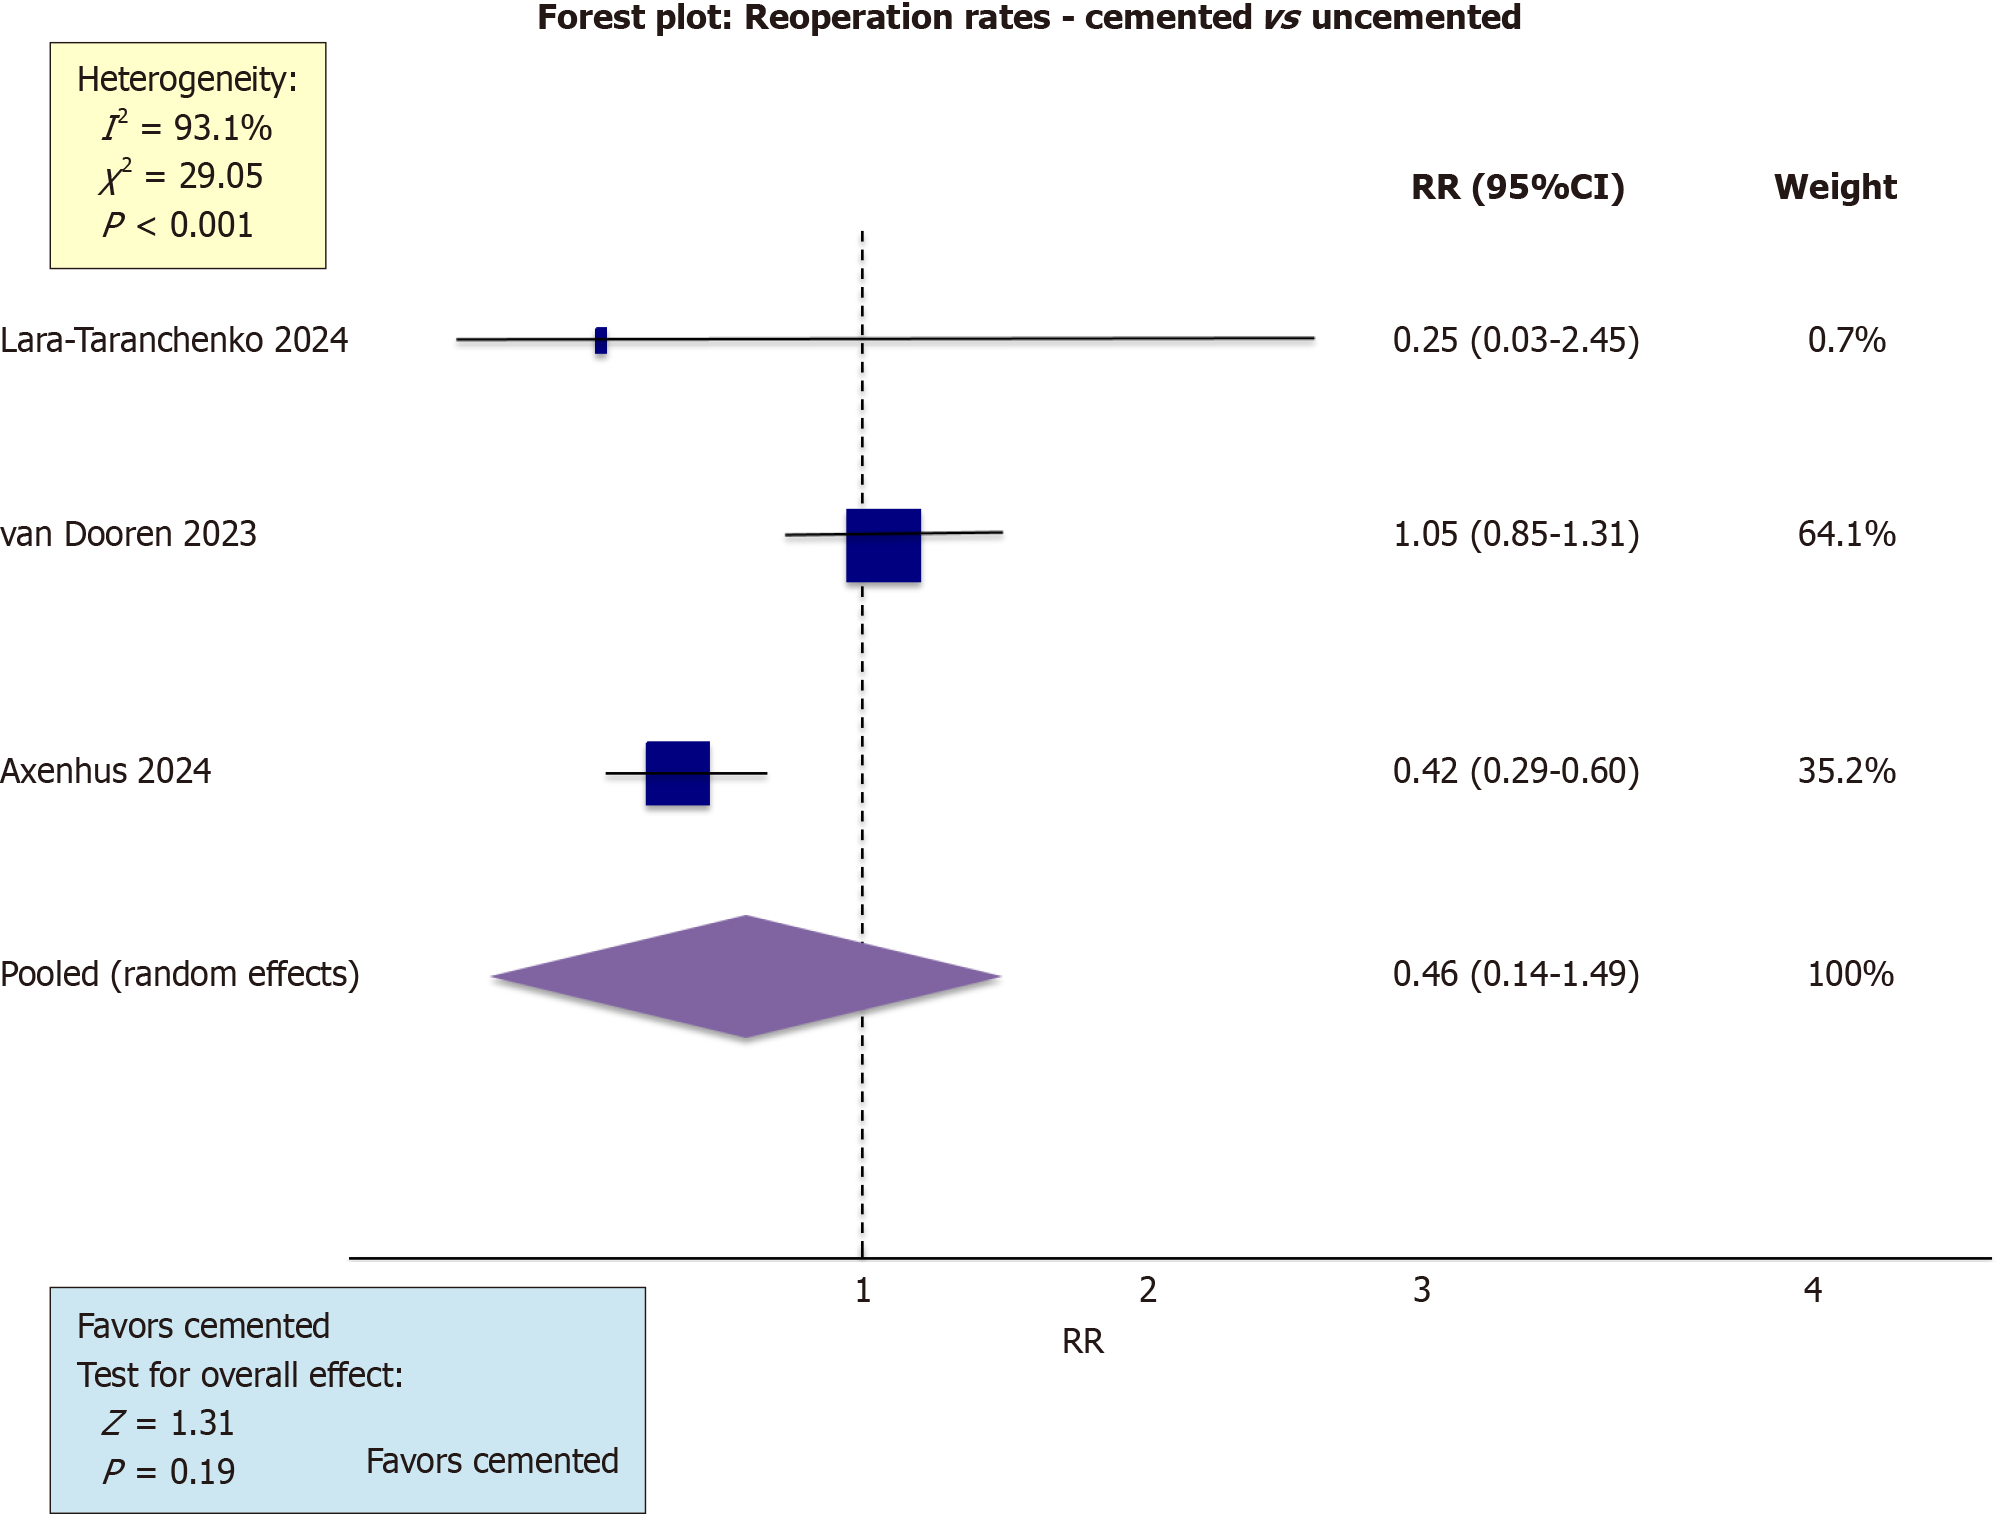
Figure 2 Forest plot showing the risk ratios and 95% confidence intervals for periprosthetic femoral fracture incidence comparing cemented vs uncemented femoral fixation in primary total hip arthroplasty.
Each study is represented by a square (proportional to study weight) and horizontal line (95% confidence interval). The pooled random-effects estimate is shown as a diamond at the bottom. The vertical dashed line at risk ratio = 1.0 represents no difference between groups; values to the left favor cemented fixation (lower fracture risk), and values to the right favor uncemented fixation. Heterogeneity statistics are displayed: I2 = 93.1%, indicating substantial heterogeneity; χ² = 29.05, P < 0.001. Test for overall effect: Z = 1.31, P = 0.19 (not statistically significant). RR: Risk ratio; CI: Confidence intervals.
- Citation: Abushal MH, Embaby OM, Mersal M, Badghish E, Elalfy M. Cemented vs uncemented femoral fixation in total hip arthroplasty: A systematic review and meta-analysis of periprosthetic fracture risk. World J Orthop 2026; 17(2): 115615
- URL: https://www.wjgnet.com/2218-5836/full/v17/i2/115615.htm
- DOI: https://dx.doi.org/10.5312/wjo.v17.i2.115615