
















©The Author(s) 2026.
World J Orthop. Feb 18, 2026; 17(2): 114984
Published online Feb 18, 2026. doi: 10.5312/wjo.v17.i2.114984
Published online Feb 18, 2026. doi: 10.5312/wjo.v17.i2.114984
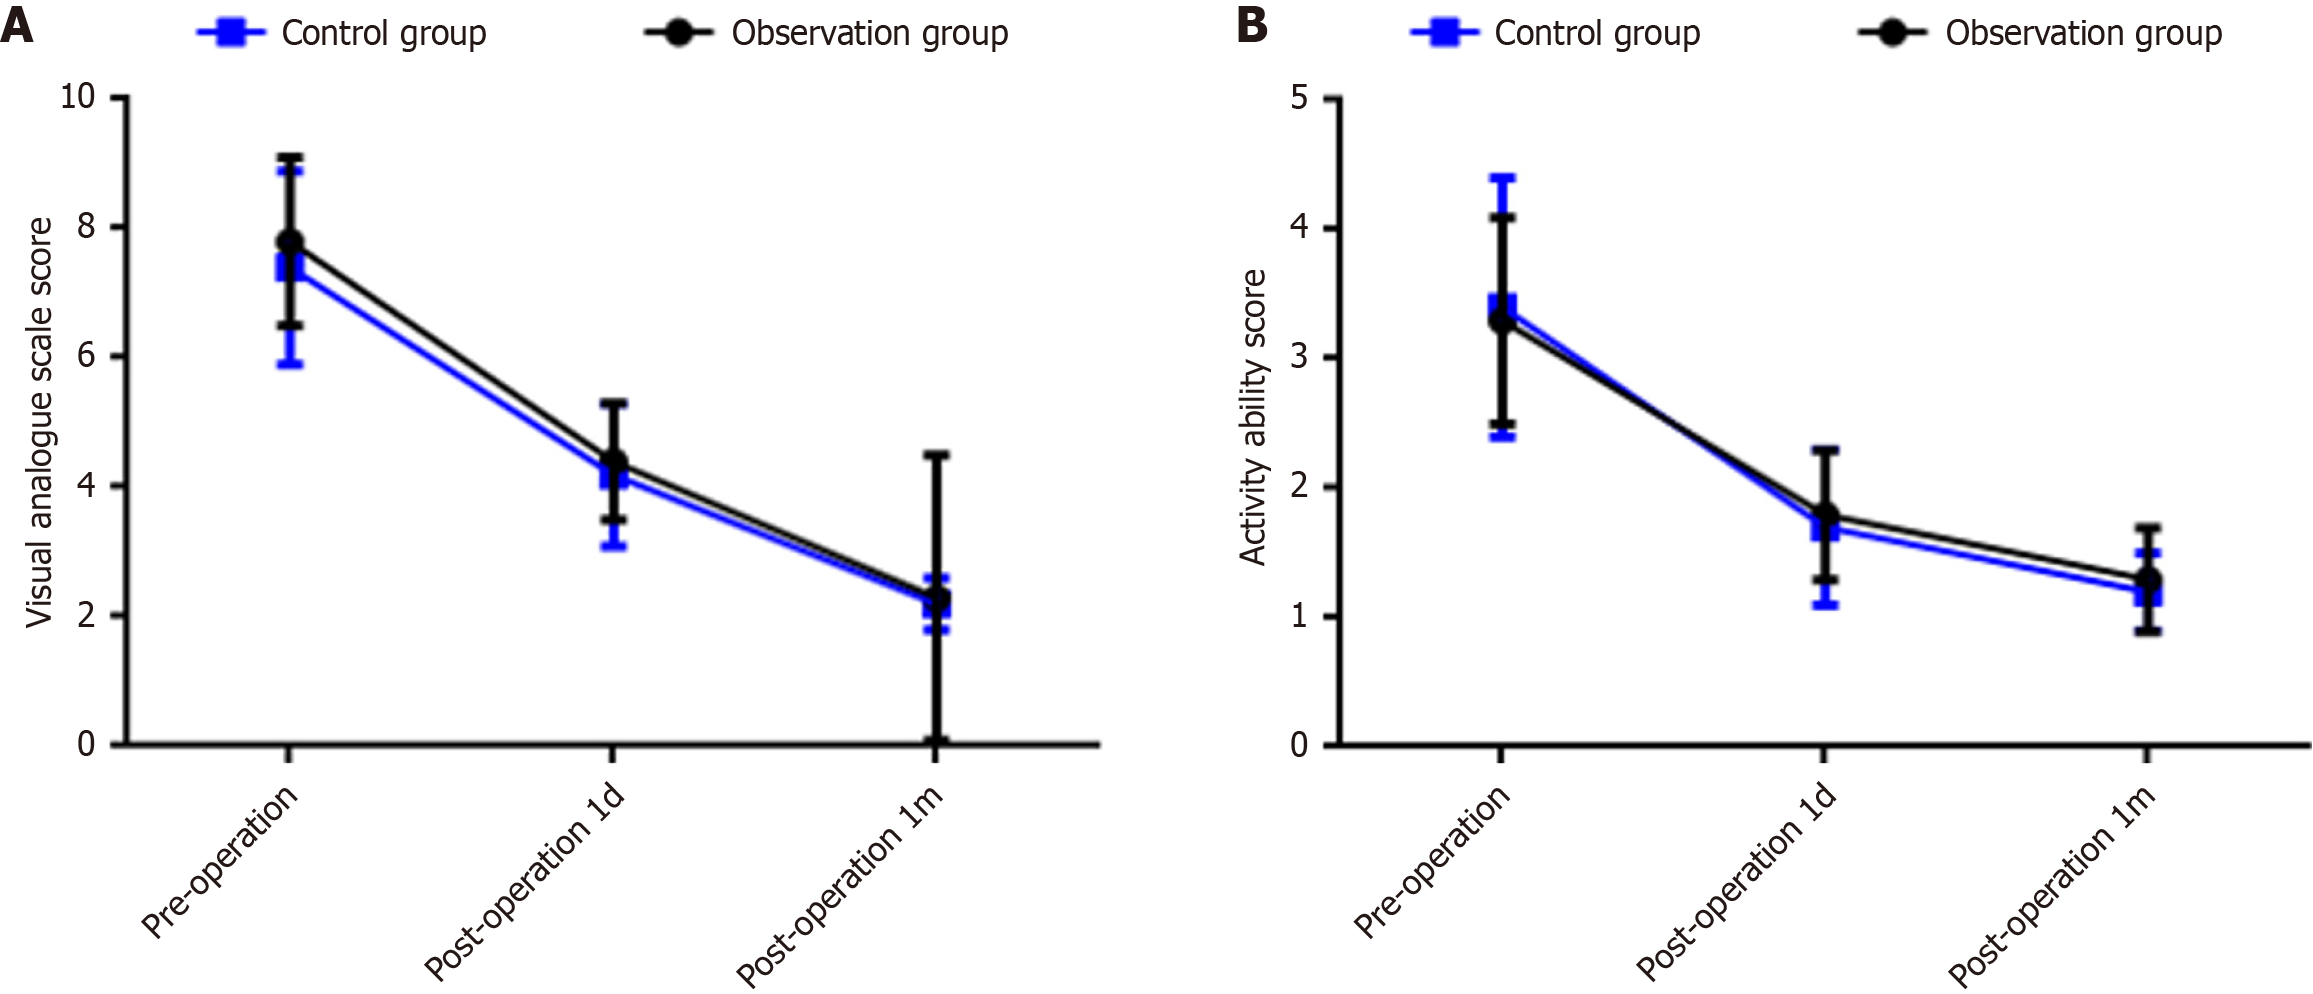
Figure 2 Comparison of visual analogue scale scores and activity ability scores between the observation group and the control group before surgery, 1 day after surgery, and 1 month after surgery.
B: Activity ability score. The horizontal axis represents the time point (pre-operation, 1 day post-operation, 1 month post-operation), and the vertical axis represents the score value). 1d: 1 day; 1m: 1 month.
- Citation: Li YF, Wu CQ, Long Y, Yu QF, Xu W, Zhao JJ, Zhang XY, Li ZK. Risk factors for thoracic-osteoporotic thoracic vertebral compression fractures during the normalized prevention and control period of COVID-19. World J Orthop 2026; 17(2): 114984
- URL: https://www.wjgnet.com/2218-5836/full/v17/i2/114984.htm
- DOI: https://dx.doi.org/10.5312/wjo.v17.i2.114984