
















Copyright: ©Author(s) 2026.
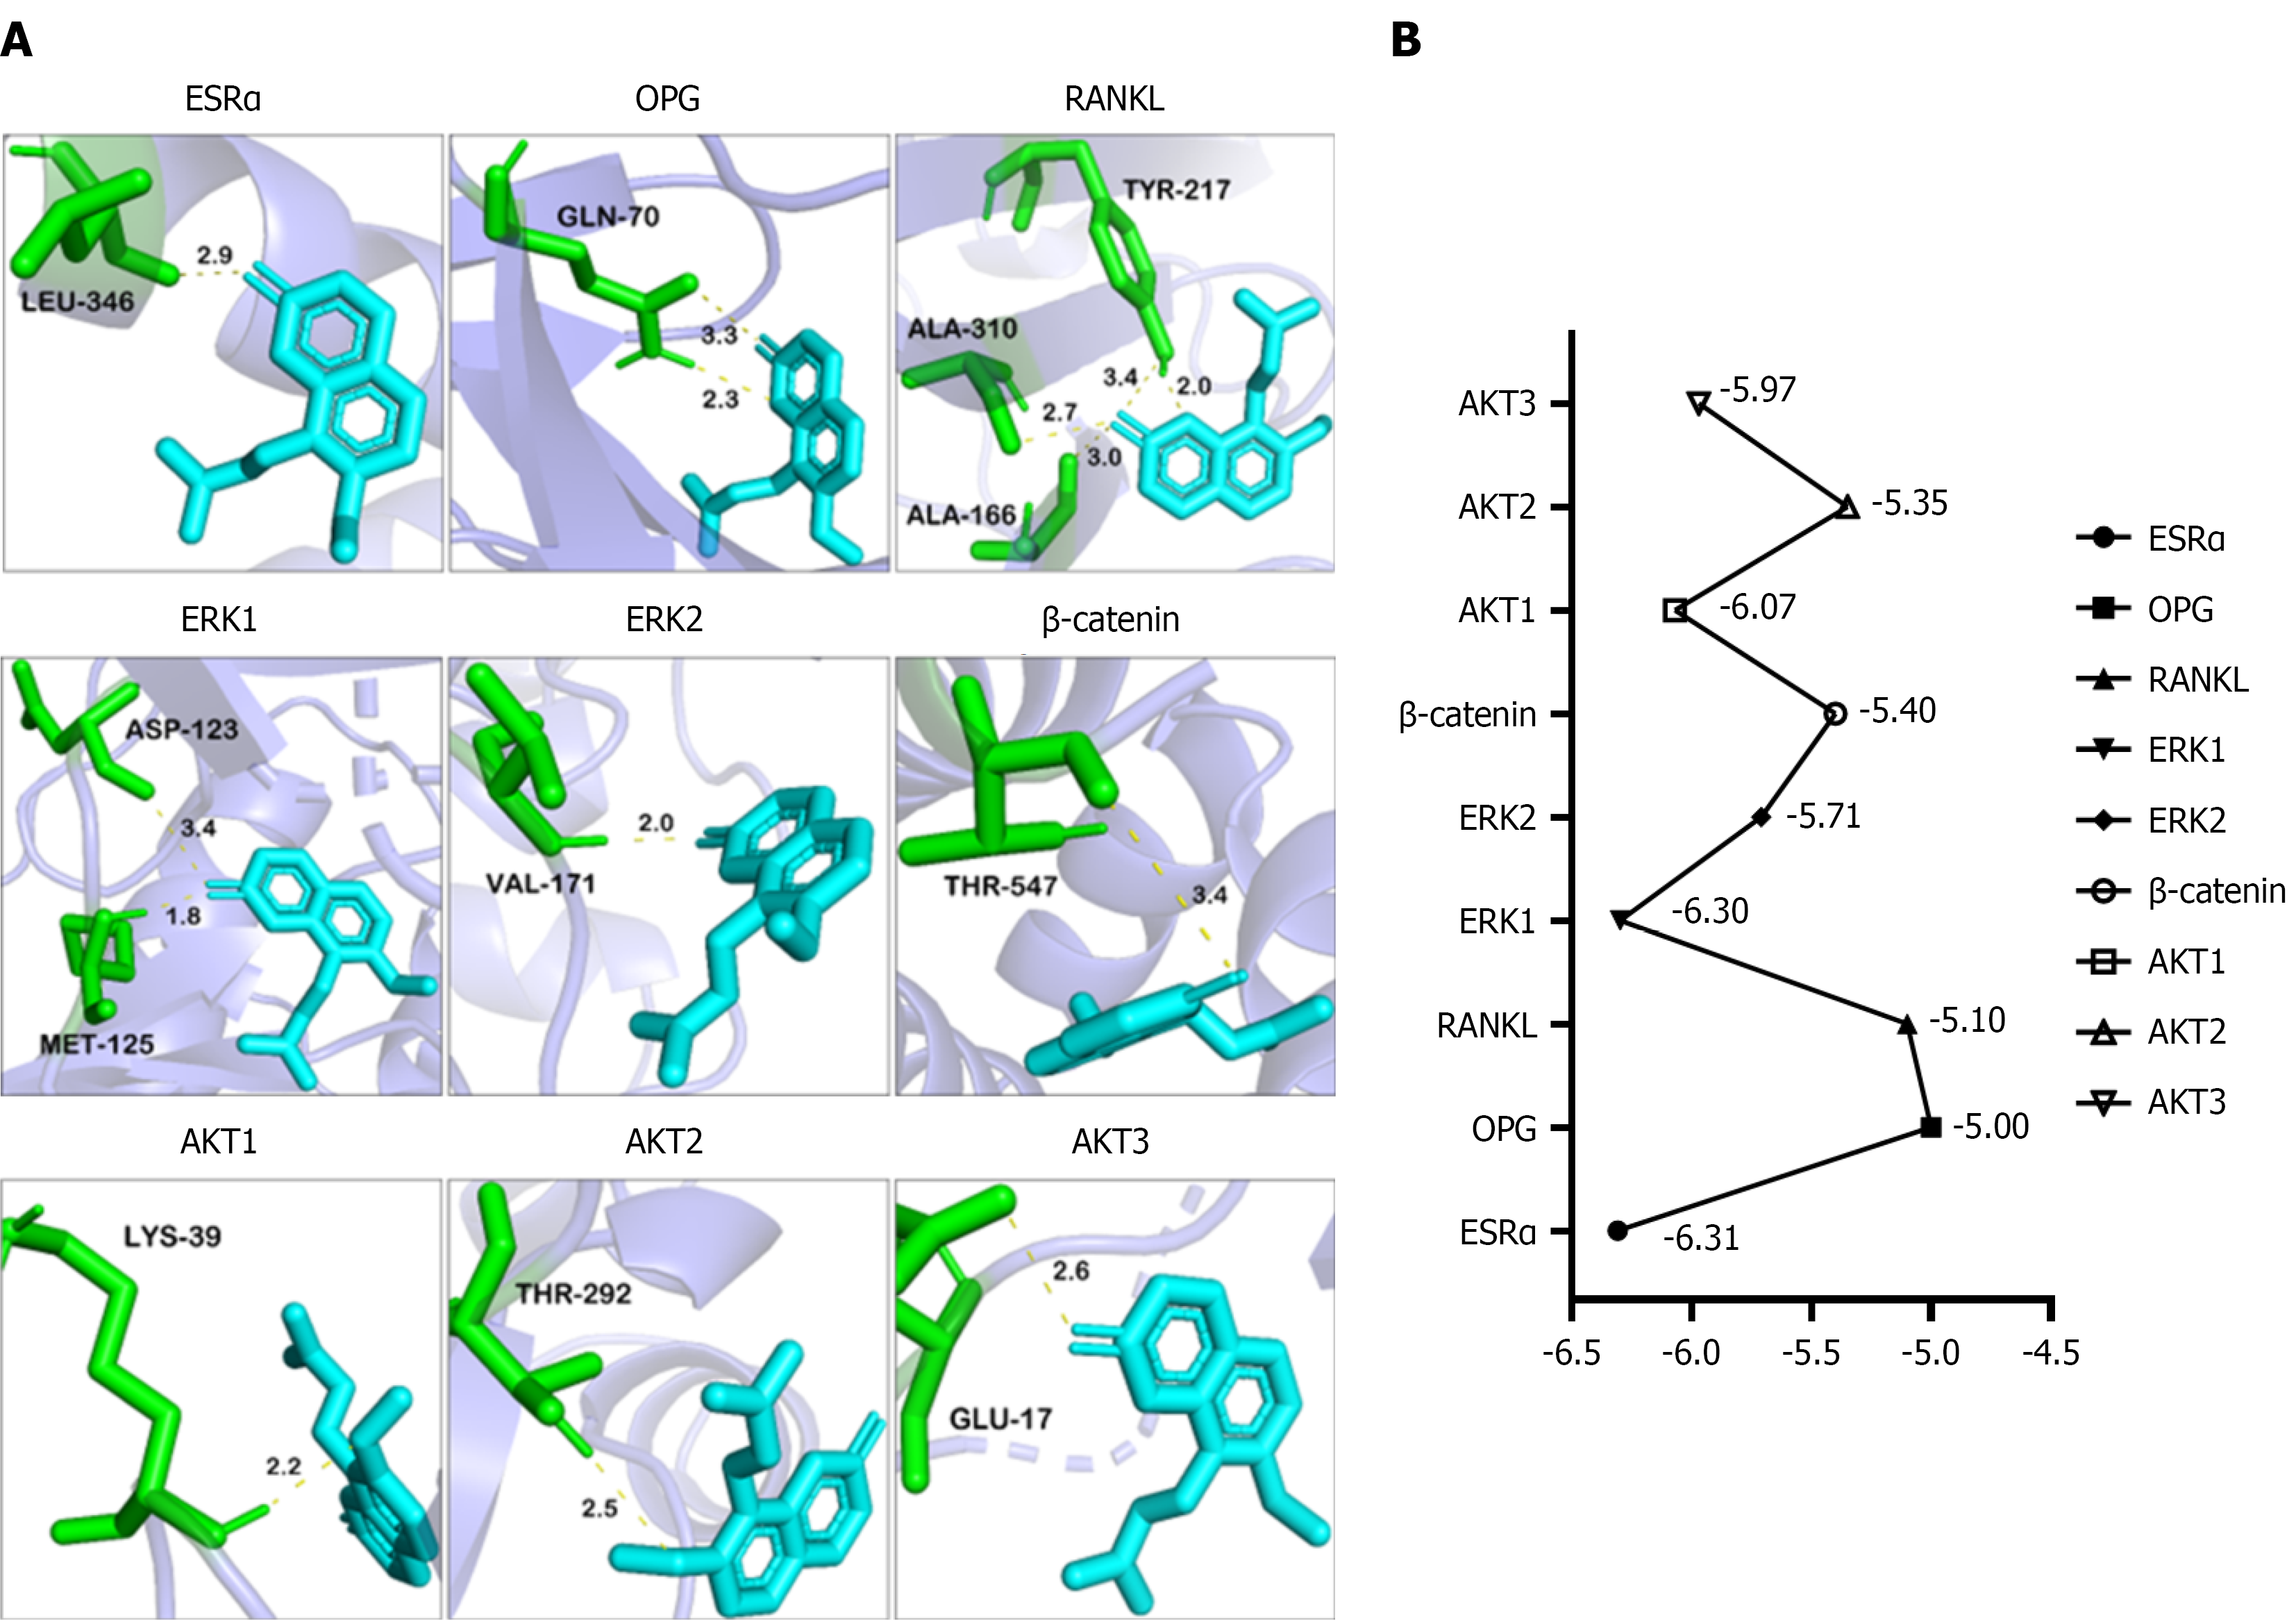
Figure 1 Molecular docking analysis of osthole with target proteins.
A: Visualised molecular docking models of osthole with target proteins at the minimum binding energy. The colour blue is used to represent the overall structure of target proteins, cyan to indicate osthole molecules, green to mark the protein structural regions interacting with osthole, and yellow dashed lines to denote the formed hydrogen bonds; B: Minimum binding energy values between osthole and each target protein (estrogen receptor α, osteoprotegerin, receptor activator of nuclear factor-κB ligand, extracellular signal-regulated kinase 1, extracellular signal-regulated kinase 2, β-catenin, protein kinase B 1, 2, and 3). The binding energy, which ranges from -5.0 kcal/mol to -7.0 kcal/mol indicates high binding affinity between osthole and the target proteins. OPG: Osteoprotegerin; ESR: Estrogen receptor; RANKL: Receptor activator of nuclear factor-κB ligand ; AKT: Protein kinase B; ERK: Extracellular signal-regulated kinase.
- Citation: Zhu TY, Yuan M, Wen XC, Tian CC, Han YH, Zheng C, Wu YT, Xia Q, Wang Y. Osthole exerts osteoprotective effect by activating ER, PI3K/AKT, MEK/ERK, and Wnt/β-catenin signaling pathways. World J Orthop 2026; 17(10): 121526
- URL: https://www.wjgnet.com/2218-5836/full/v17/i10/121526.htm
- DOI: https://dx.doi.org/10.5312/wjo.121526