
















©The Author(s) 2026.
World J Orthop. Jan 18, 2026; 17(1): 112262
Published online Jan 18, 2026. doi: 10.5312/wjo.v17.i1.112262
Published online Jan 18, 2026. doi: 10.5312/wjo.v17.i1.112262
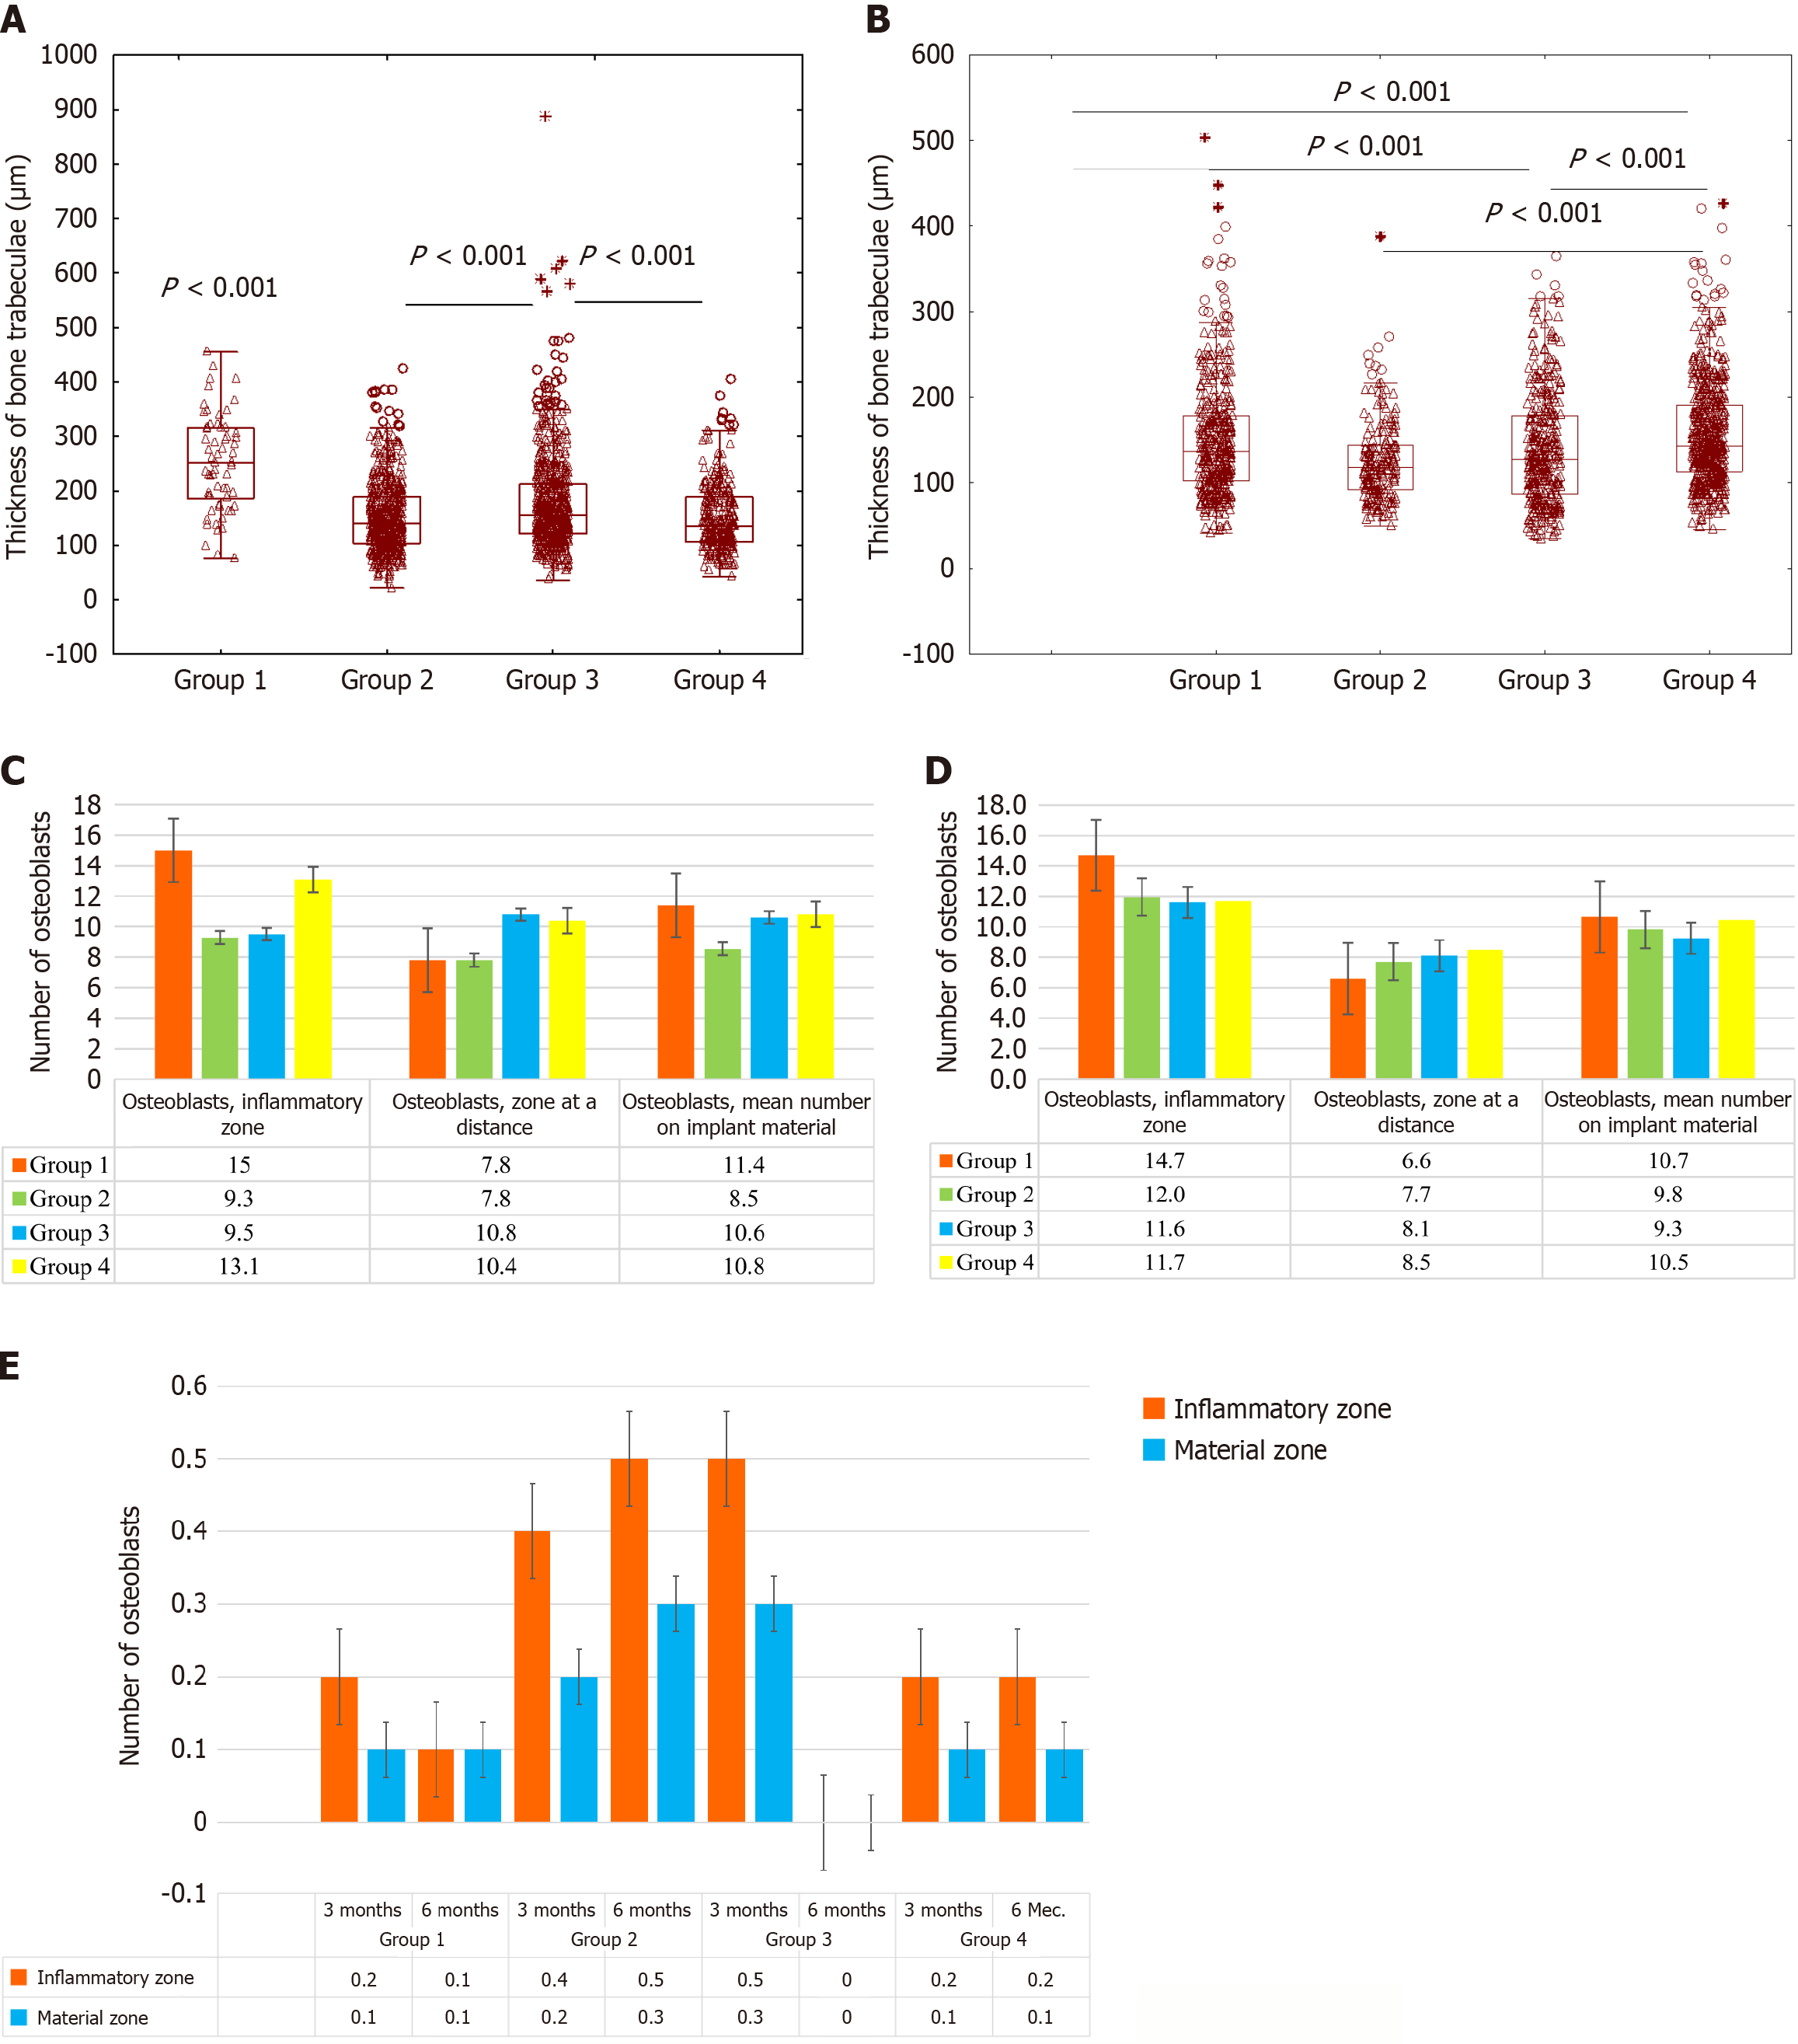
Figure 4 Quantitative histomorphometry analysis of bone remodeling in the femoral epiphysis.
A and B: Thickness of bone trabeculae in the epiphysis at 3 months and 6 months control points, measured in micrometers (μm); C and D: Number of osteoblasts per high-power field in the femoral epiphysis at 3 months and 6 months control points (magnification × 1000), median; E: Number of osteoclasts per high-power field in femoral epiphyses (magnification × 1000), median.
- Citation: Petukhova VV, Mushkin AY, Maletin AS, Dogonadze MZ, Zabolotnykh NV, Dyakova ME, Esmedlyaeva DS, Vinogradova TI, Kostik MM. Novel use of bisphosphonates to improve surgical outcomes in experimental bone tuberculosis. World J Orthop 2026; 17(1): 112262
- URL: https://www.wjgnet.com/2218-5836/full/v17/i1/112262.htm
- DOI: https://dx.doi.org/10.5312/wjo.v17.i1.112262