
















©The Author(s) 2026.
World J Orthop. Jan 18, 2026; 17(1): 110188
Published online Jan 18, 2026. doi: 10.5312/wjo.v17.i1.110188
Published online Jan 18, 2026. doi: 10.5312/wjo.v17.i1.110188
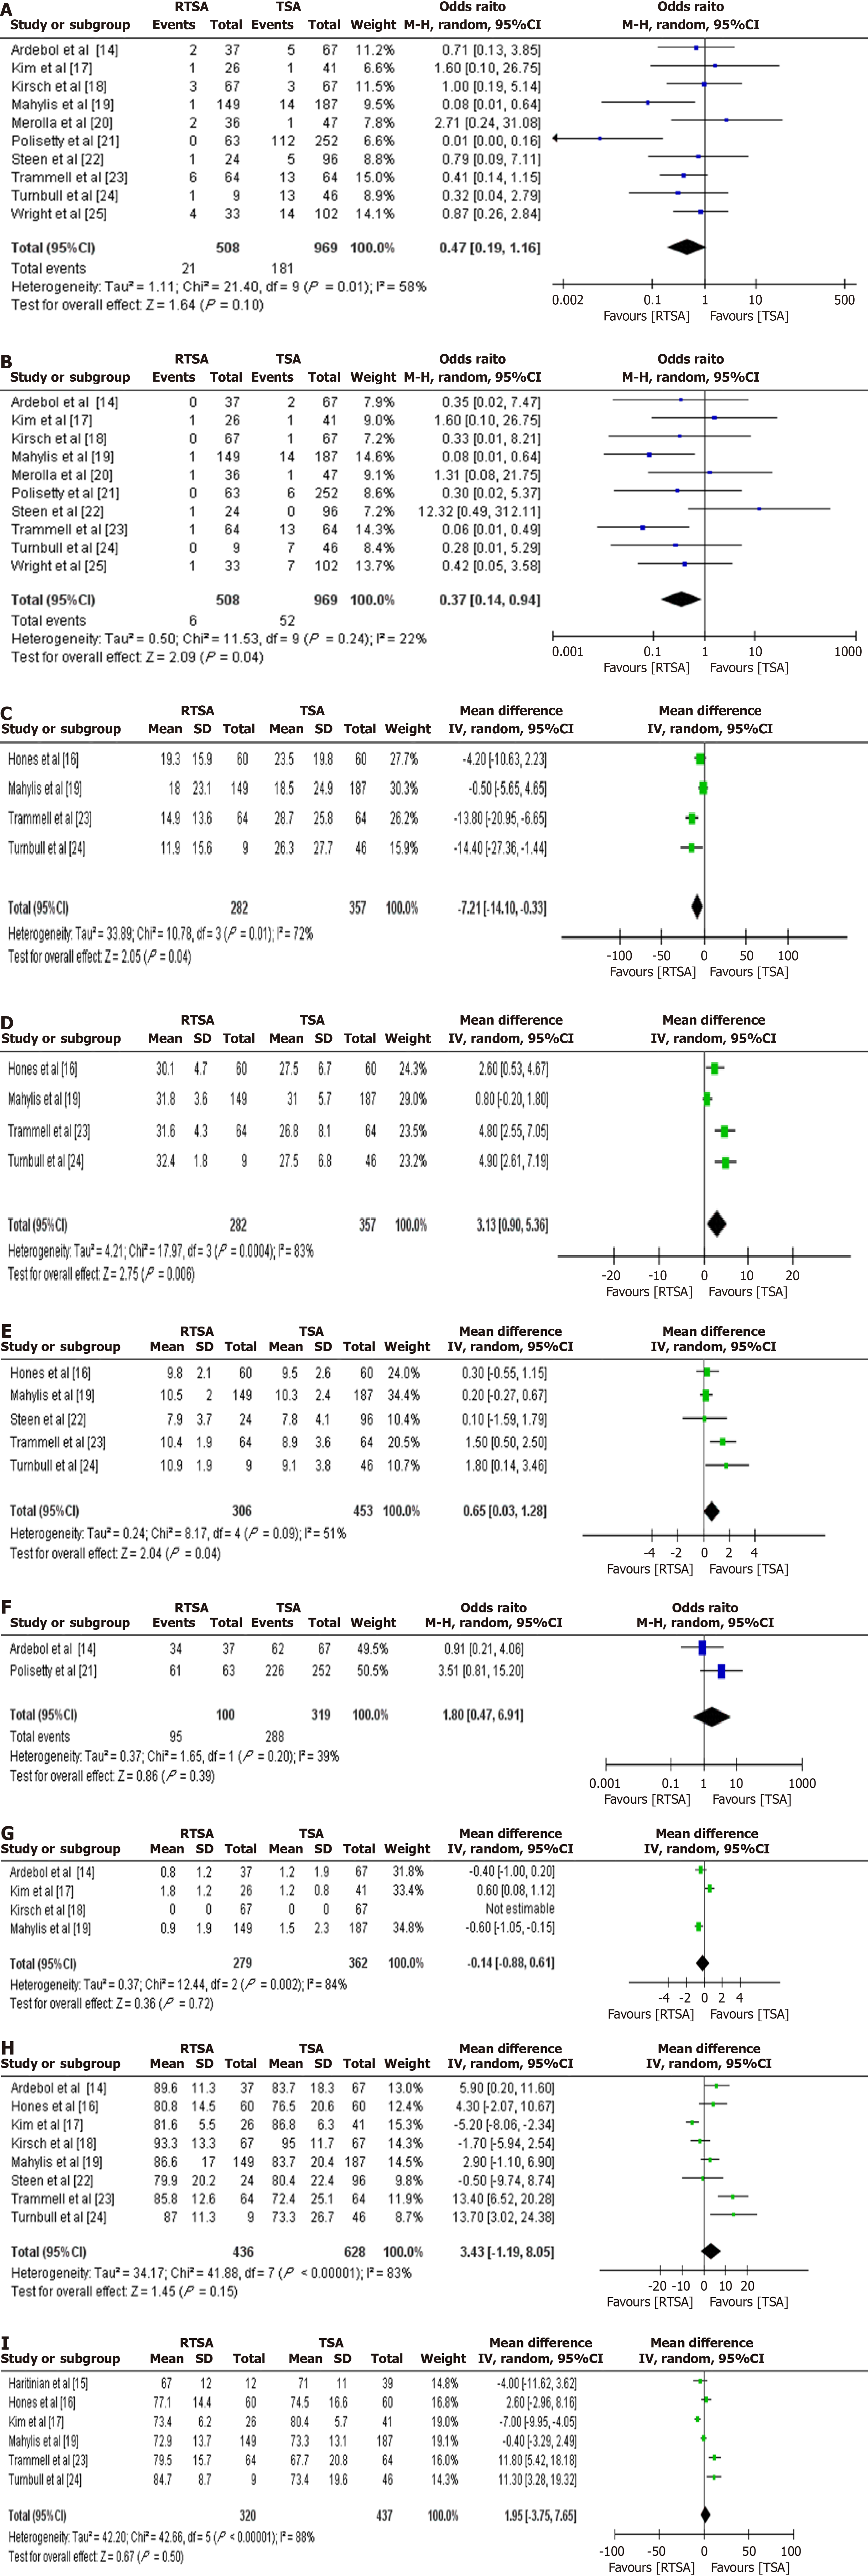
Figure 4 Forest plots comparing complications, reoperations, functional scores, and patient satisfaction between reverse total shoulder arthroplasty and total shoulder arthroplasty.
A: Forest plot comparing complication rates between reverse total shoulder arthroplasty (RTSA) and total shoulder arthroplasty (TSA); B: Forest plot comparing reoperation rates between RTSA and TSA; C: Forest plot comparing Shoulder Pain and Disability Index scores postoperatively between RTSA and TSA; D: Forest plot comparing University of California Los Angeles scores between RTSA and TSA; E: Forest plot comparing Simple Shoulder Test scores between RTSA and TSA; F: Forest plot comparing patient satisfaction rates between RTSA and TSA; G: Forest plot comparing Visual Analog Scale pain scores between RTSA and TSA; H: Forest plot comparing American Shoulder and Elbow Surgeons scores between RTSA and TSA; I: Forest plot comparing Constant Scores between RTSA and TSA. CI: Confidence interval; RTSA: Reverse total shoulder arthroplasty; TSA: Total shoulder arthroplasty.
- Citation: Desouza C, Siddique I, Kushwaha K, Puri A. Outcomes of reverse vs anatomic total shoulder arthroplasty in glenohumeral osteoarthritis without rotator cuff deficiency: A meta-analysis. World J Orthop 2026; 17(1): 110188
- URL: https://www.wjgnet.com/2218-5836/full/v17/i1/110188.htm
- DOI: https://dx.doi.org/10.5312/wjo.v17.i1.110188