Copyright
©The Author(s) 2025.
World J Orthop. Jul 18, 2025; 16(7): 107698
Published online Jul 18, 2025. doi: 10.5312/wjo.v16.i7.107698
Published online Jul 18, 2025. doi: 10.5312/wjo.v16.i7.107698
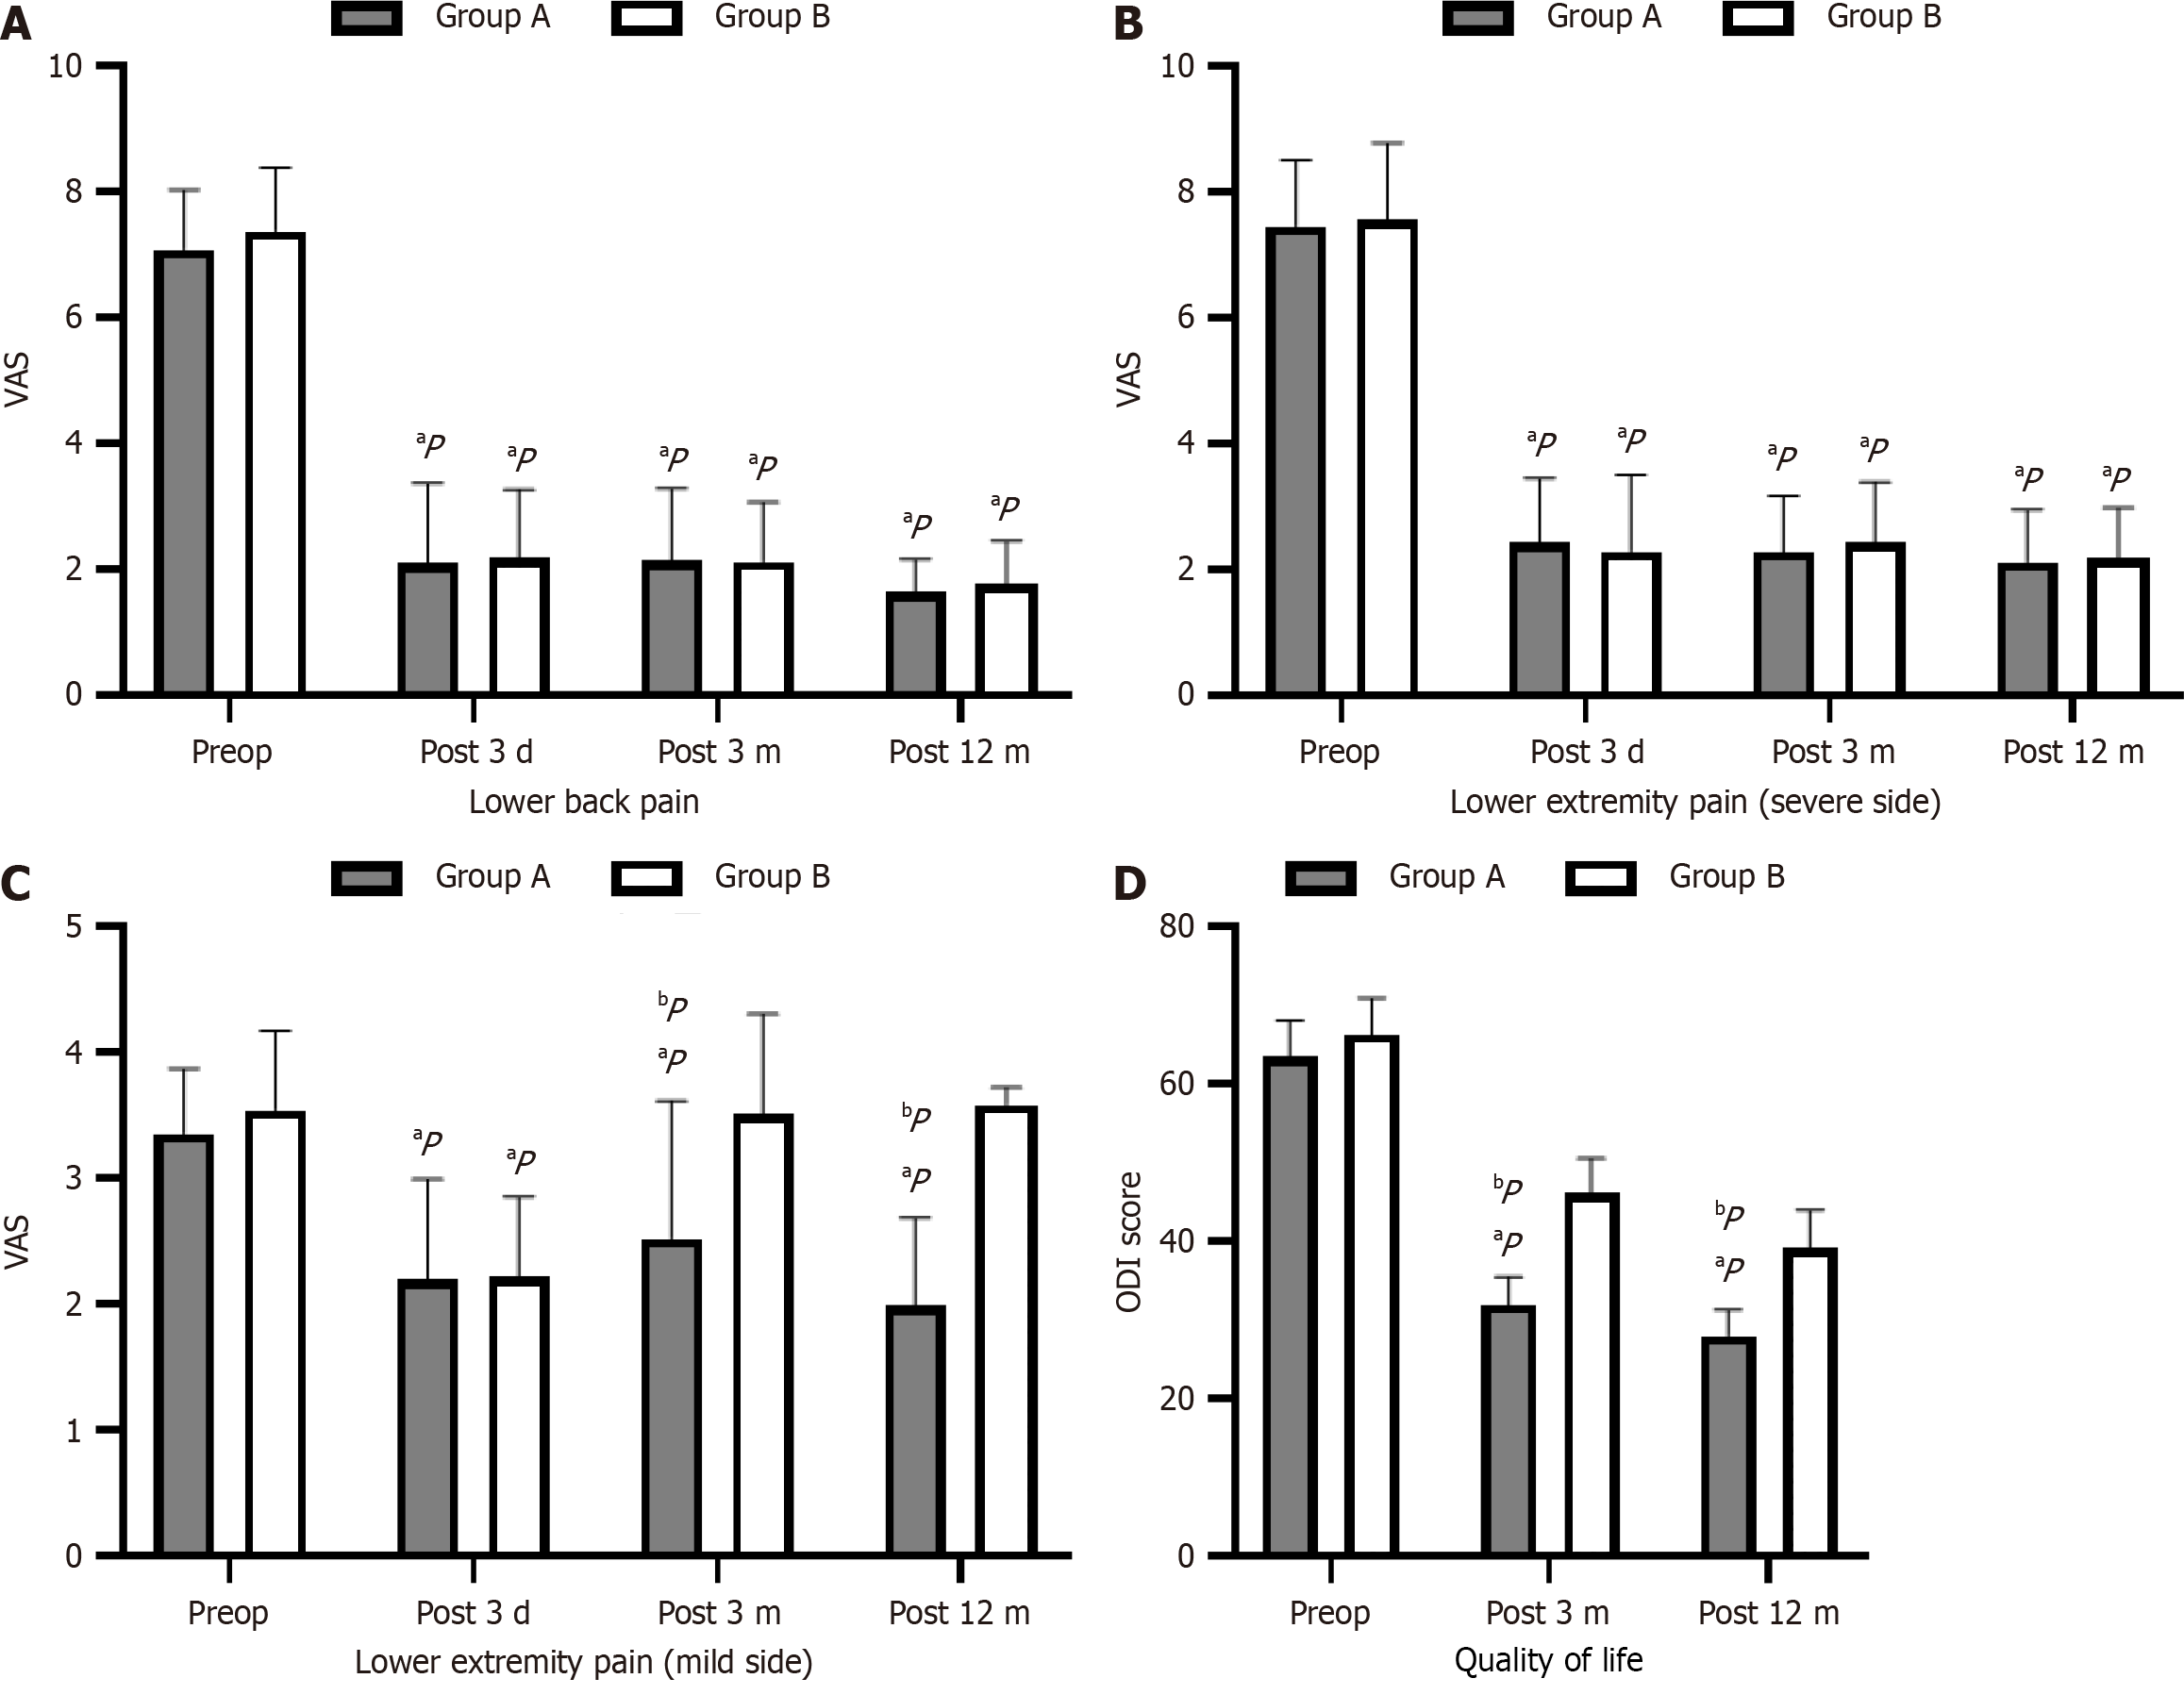
Figure 3 Clinical outcomes in both groups.
A: Comparison of lower back pain scores between the two groups; B: Comparison of lower extremity pain (severe side) between the two groups; C: Comparison of lower extremity pain (mild side) between the two groups; D: Comparison of quality of life Oswestry Disability Index scores between the two groups. aP < 0.05: Means there was significant difference before and after operation (P < 0.05); bP < 0.05: Means there was significant difference between groups (P < 0.05). ODI: Oswestry Disability Index; VAS: Visual analogue scale.
- Citation: Guo S, Hang RN, Zhu K, Wu CQ, Yan MJ, Li XH, Liu YB, Fu Q. Comparison of clinical outcomes between biportal and uniportal full-endoscopy techniques in lumbar spinal stenosis with bilateral symptoms. World J Orthop 2025; 16(7): 107698
- URL: https://www.wjgnet.com/2218-5836/full/v16/i7/107698.htm
- DOI: https://dx.doi.org/10.5312/wjo.v16.i7.107698


