Copyright
©The Author(s) 2025.
World J Orthop. May 18, 2025; 16(5): 106183
Published online May 18, 2025. doi: 10.5312/wjo.v16.i5.106183
Published online May 18, 2025. doi: 10.5312/wjo.v16.i5.106183
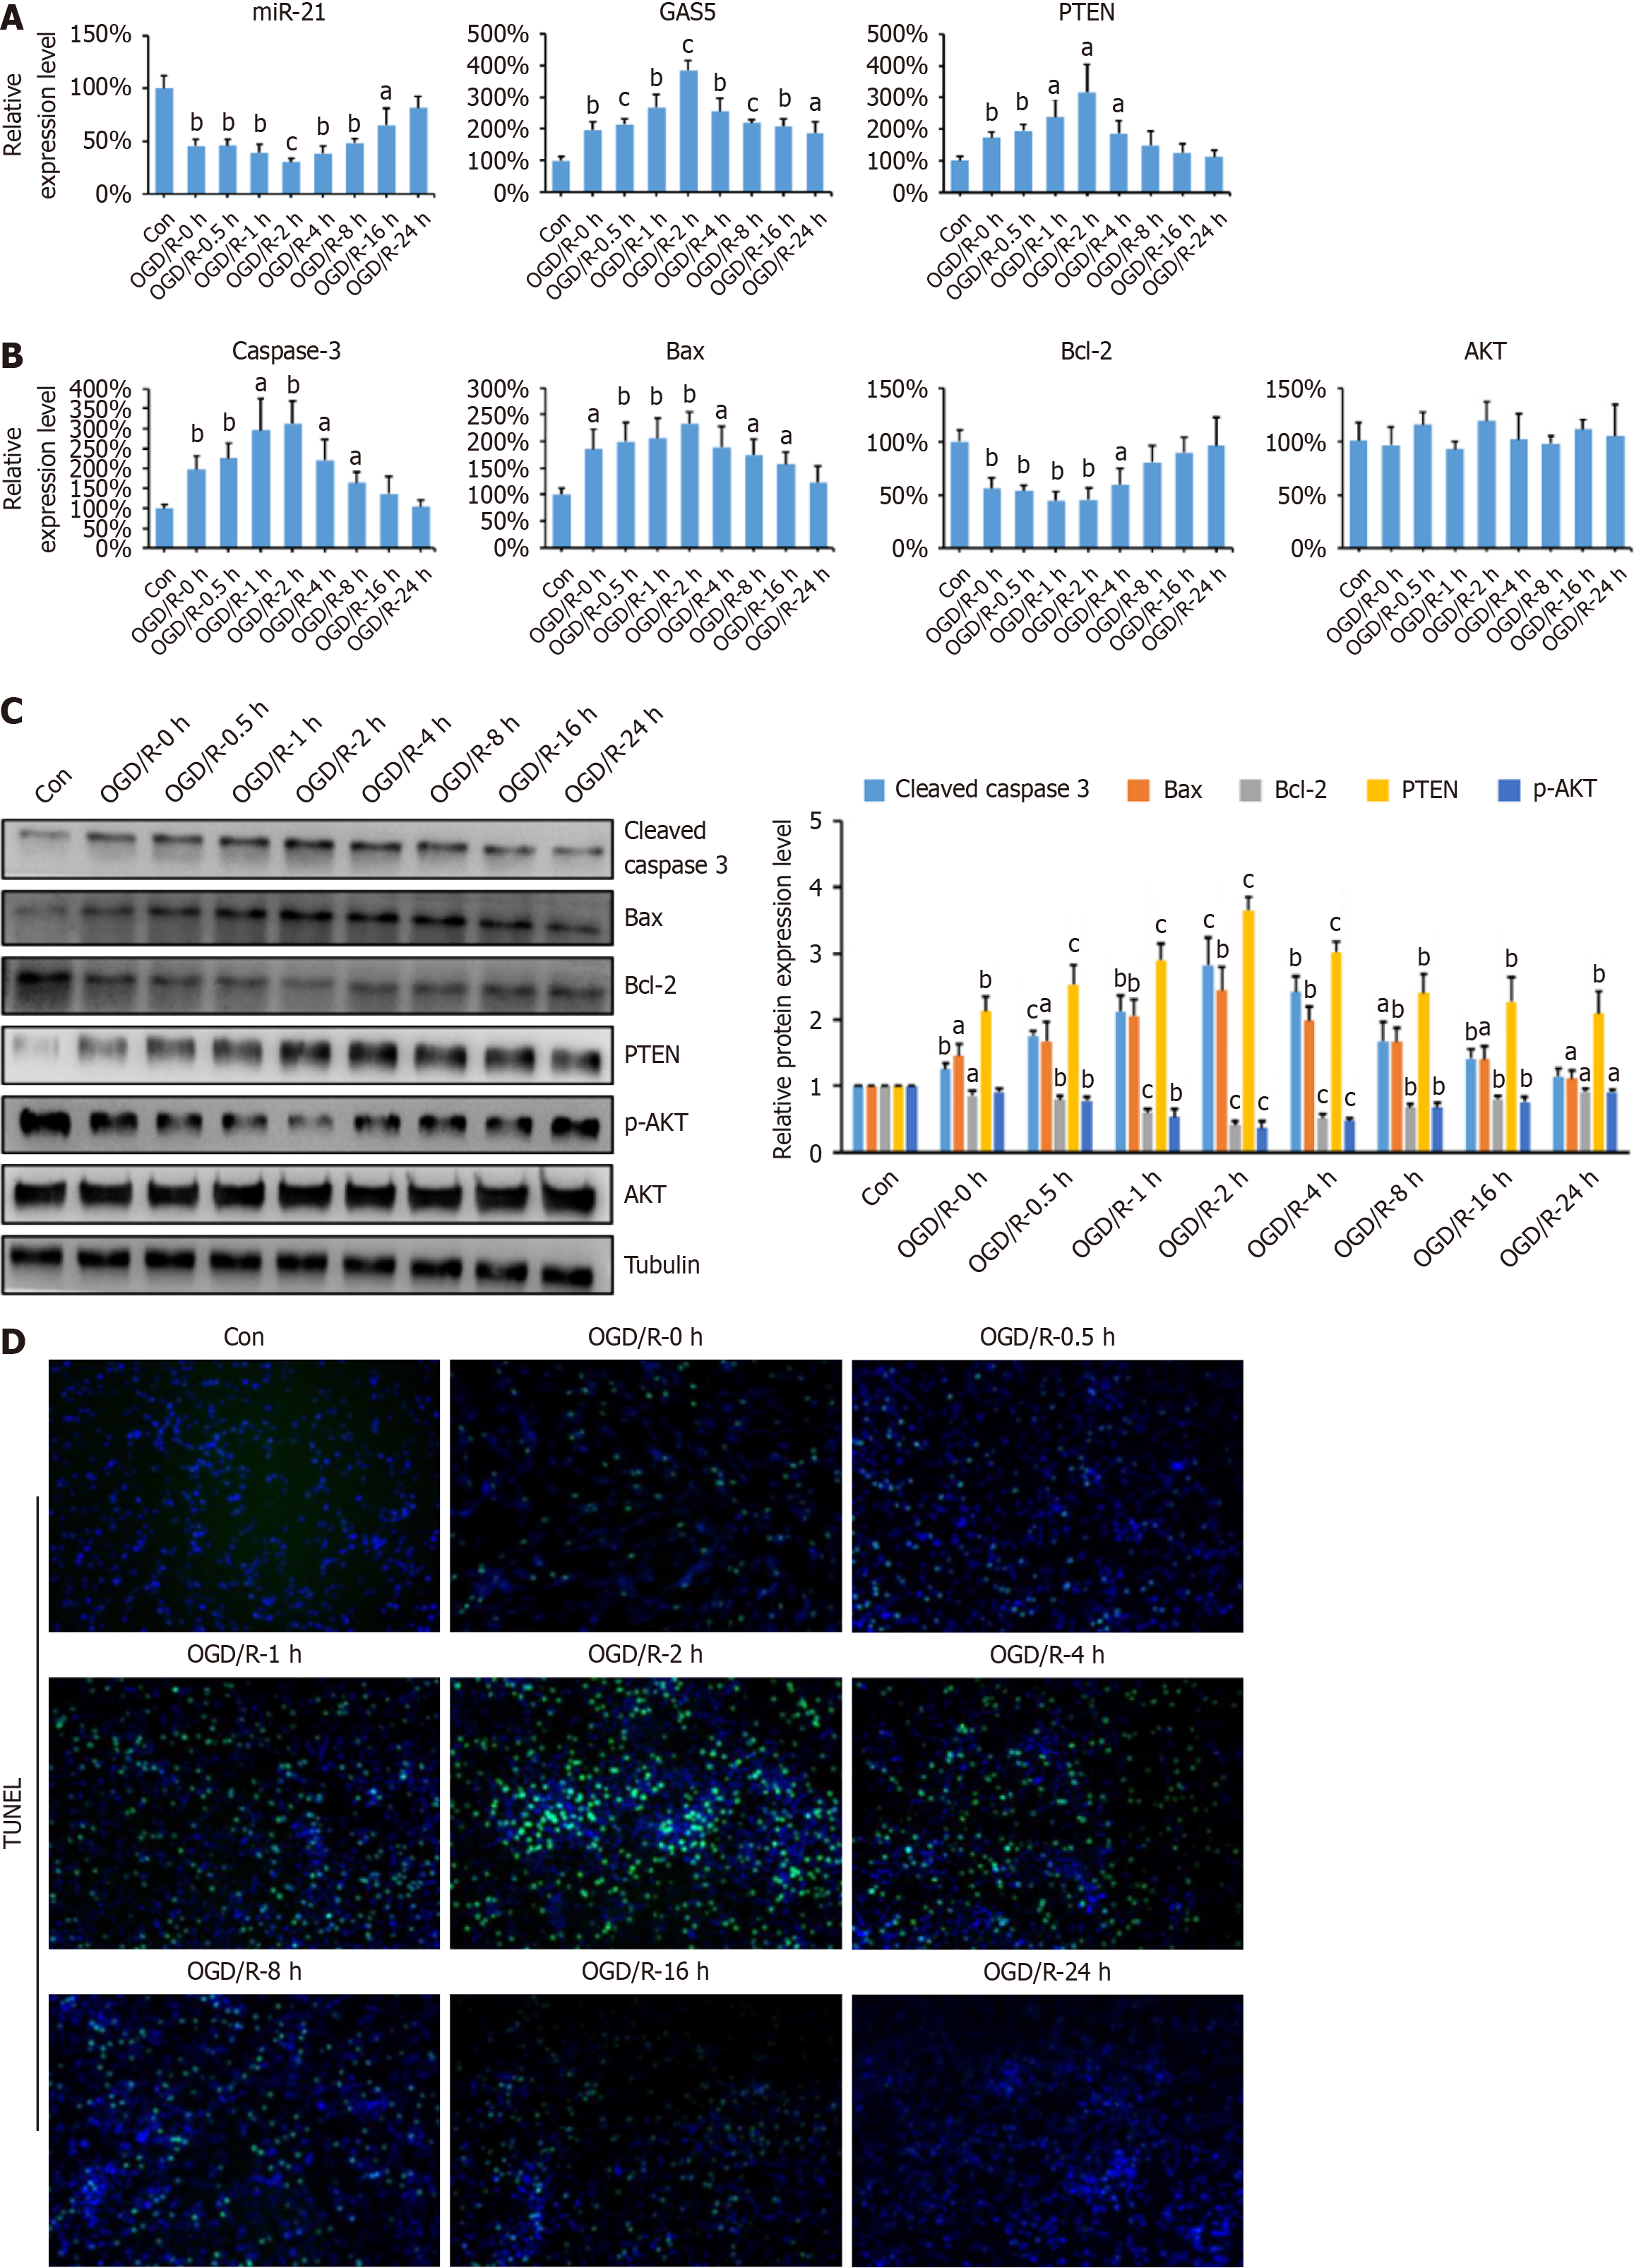
Figure 2 Growth arrest-specific transcript 5 promoted neuronal apoptosis in the PC12 oxygen-glucose deprivation/reoxygenation model.
A: Relative expression levels of microRNA (miR)-21, growth arrest-specific transcript 5, and phosphatase and tensin homolog (PTEN) in PC12 cells subjected to oxygen-glucose deprivation/reoxygenation (OGD/R) treatment, compared to controls (n = 3 per group); B: mRNA relative expression levels of caspase-3, B-cell lymphoma 2 (Bcl-2), Bcl-2-associated X protein (Bax), and AKT in PC-12 cells after OGD/R treatment (n = 3 per group); C: Protein expression of cleaved caspase-3, Bcl-2, Bax, PTEN, AKT, and phosphorylated AKT (p-AKT) in PC-12 cells detected by western blotting. The bar graph represents the relative expression levels of the aforementioned proteins. The endogenous control utilized was tubulin (n = 3 per group); D: TUNEL staining of PC12 cells after OGD/R treatment. The data are presented as the mean ± SD. aP < 0.05, bP < 0.01, and cP < 0.001 vs control group.
- Citation: Wang YJ, Zhi ZZ, Liu T, Kang J, Xu GH. Long non-coding RNA GAS5 promotes neuronal apoptosis in spinal cord injury via the miR-21/PTEN axis. World J Orthop 2025; 16(5): 106183
- URL: https://www.wjgnet.com/2218-5836/full/v16/i5/106183.htm
- DOI: https://dx.doi.org/10.5312/wjo.v16.i5.106183


