Copyright
©The Author(s) 2025.
World J Orthop. May 18, 2025; 16(5): 106145
Published online May 18, 2025. doi: 10.5312/wjo.v16.i5.106145
Published online May 18, 2025. doi: 10.5312/wjo.v16.i5.106145
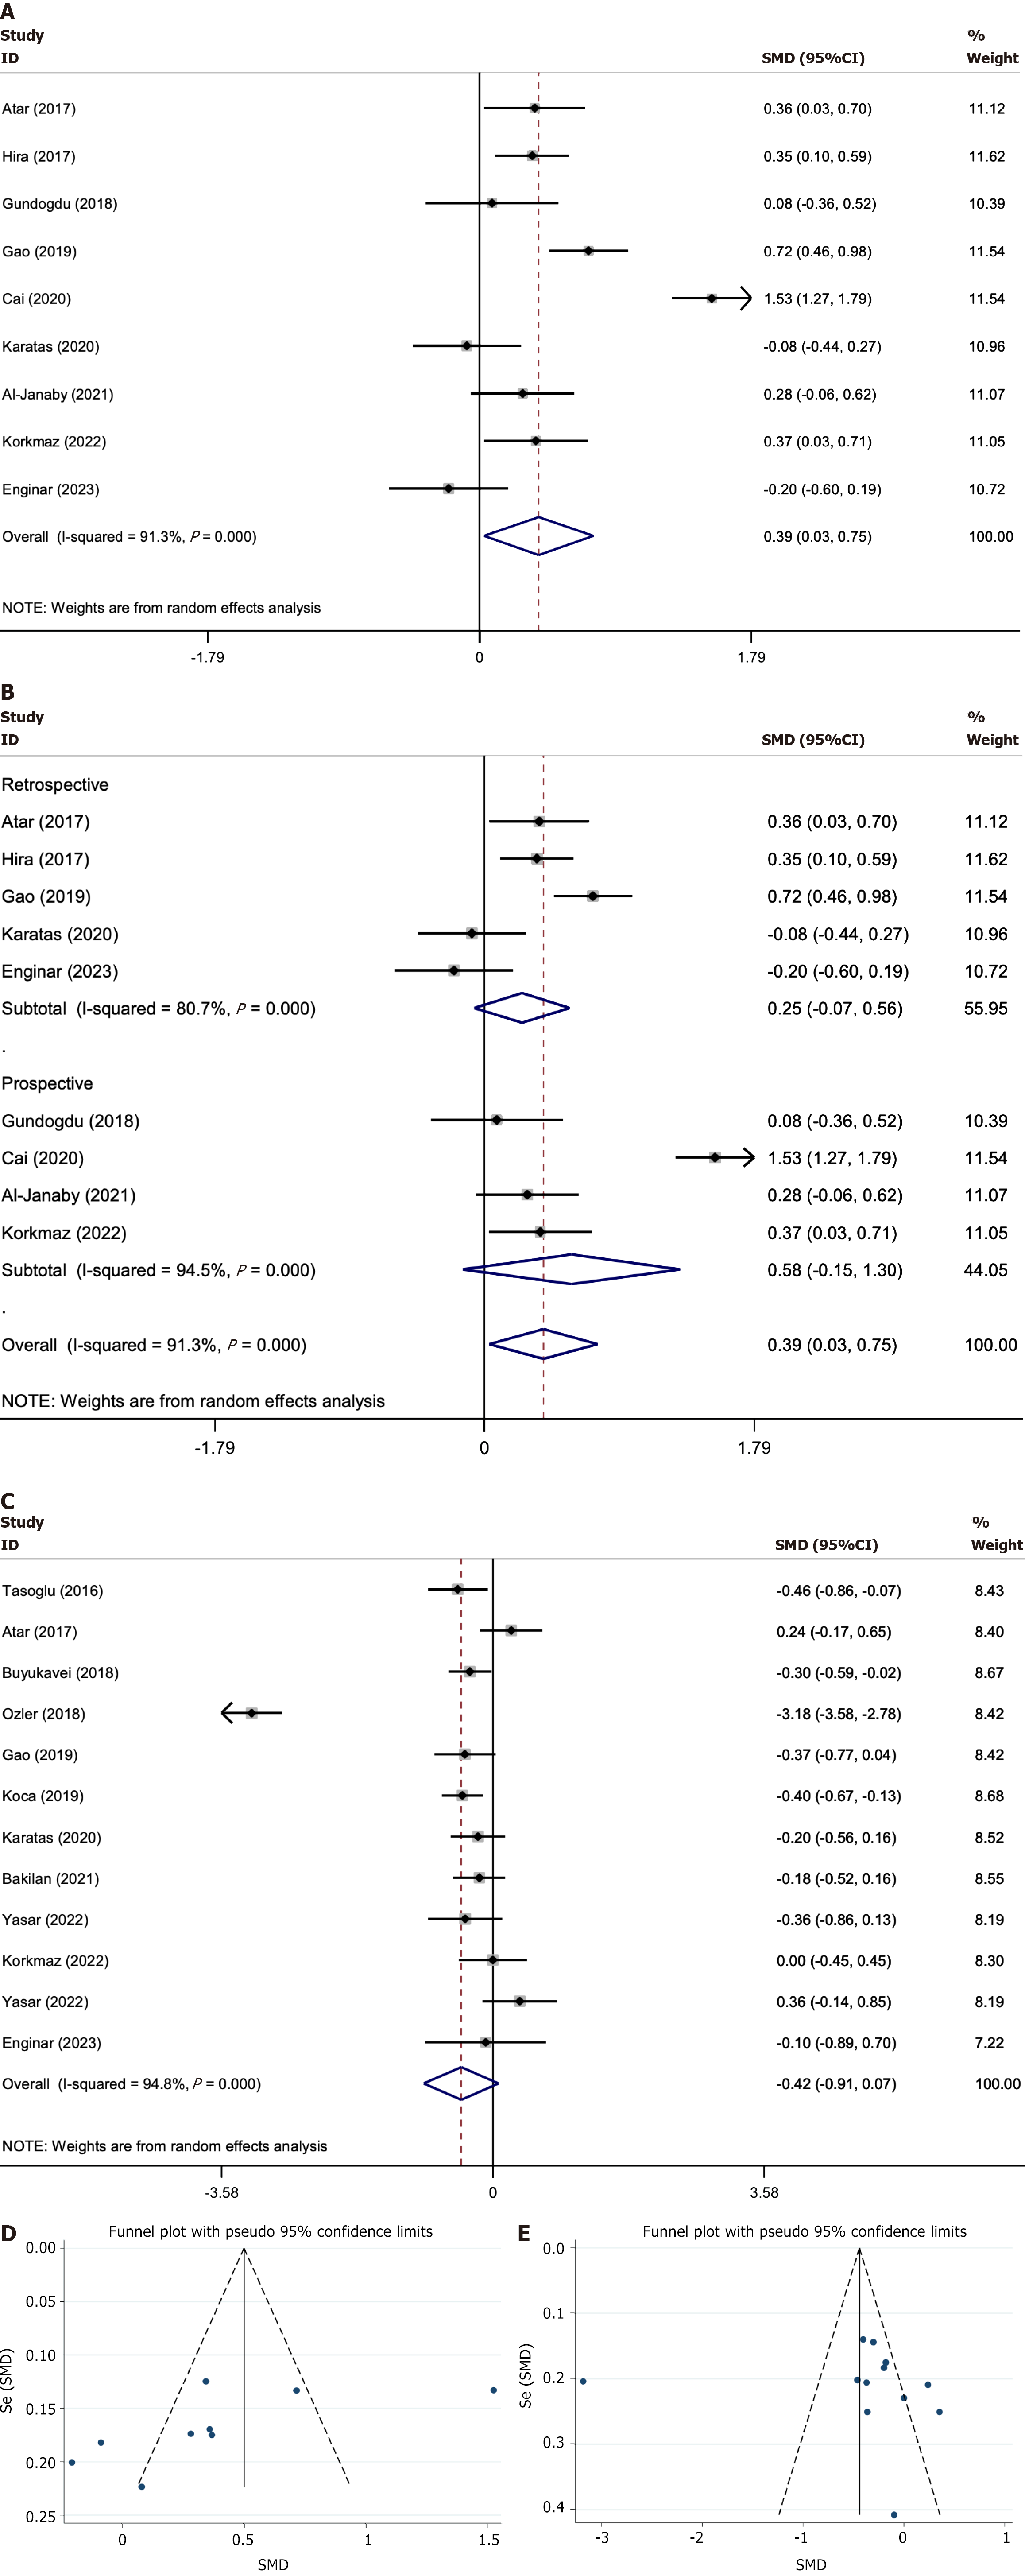
Figure 2 Meta-analysis of neutrophil-to-lymphocyte ratio levels.
A: Meta-analysis of neutrophil-to-lymphocyte ratio (NLR) levels in patients with osteoarthritis (OA) compared to healthy controls; B: Subgroup meta-analysis of NLR levels in patients with OA compared to healthy controls, according to study design; C: Meta-analysis of NLR levels in patients with severe OA compared to those with mild-moderate OA; D: Funnel plot showing publication bias. Studies on NLR levels in patients with OA compared to healthy controls; E: Studies on NLR levels in patients with severe OA compared to those with mild-moderate OA. SMD: Standardized mean difference; CI: Confidence interval.
- Citation: Salimi M, Khanzadeh S, Lucke-Wold B, Ghaedi A, Stone AV. Role of neutrophil to lymphocyte ratio in osteoarthritis: A systematic review and meta-analysis. World J Orthop 2025; 16(5): 106145
- URL: https://www.wjgnet.com/2218-5836/full/v16/i5/106145.htm
- DOI: https://dx.doi.org/10.5312/wjo.v16.i5.106145


