
















©The Author(s) 2025.
World J Orthop. Dec 18, 2025; 16(12): 113320
Published online Dec 18, 2025. doi: 10.5312/wjo.v16.i12.113320
Published online Dec 18, 2025. doi: 10.5312/wjo.v16.i12.113320
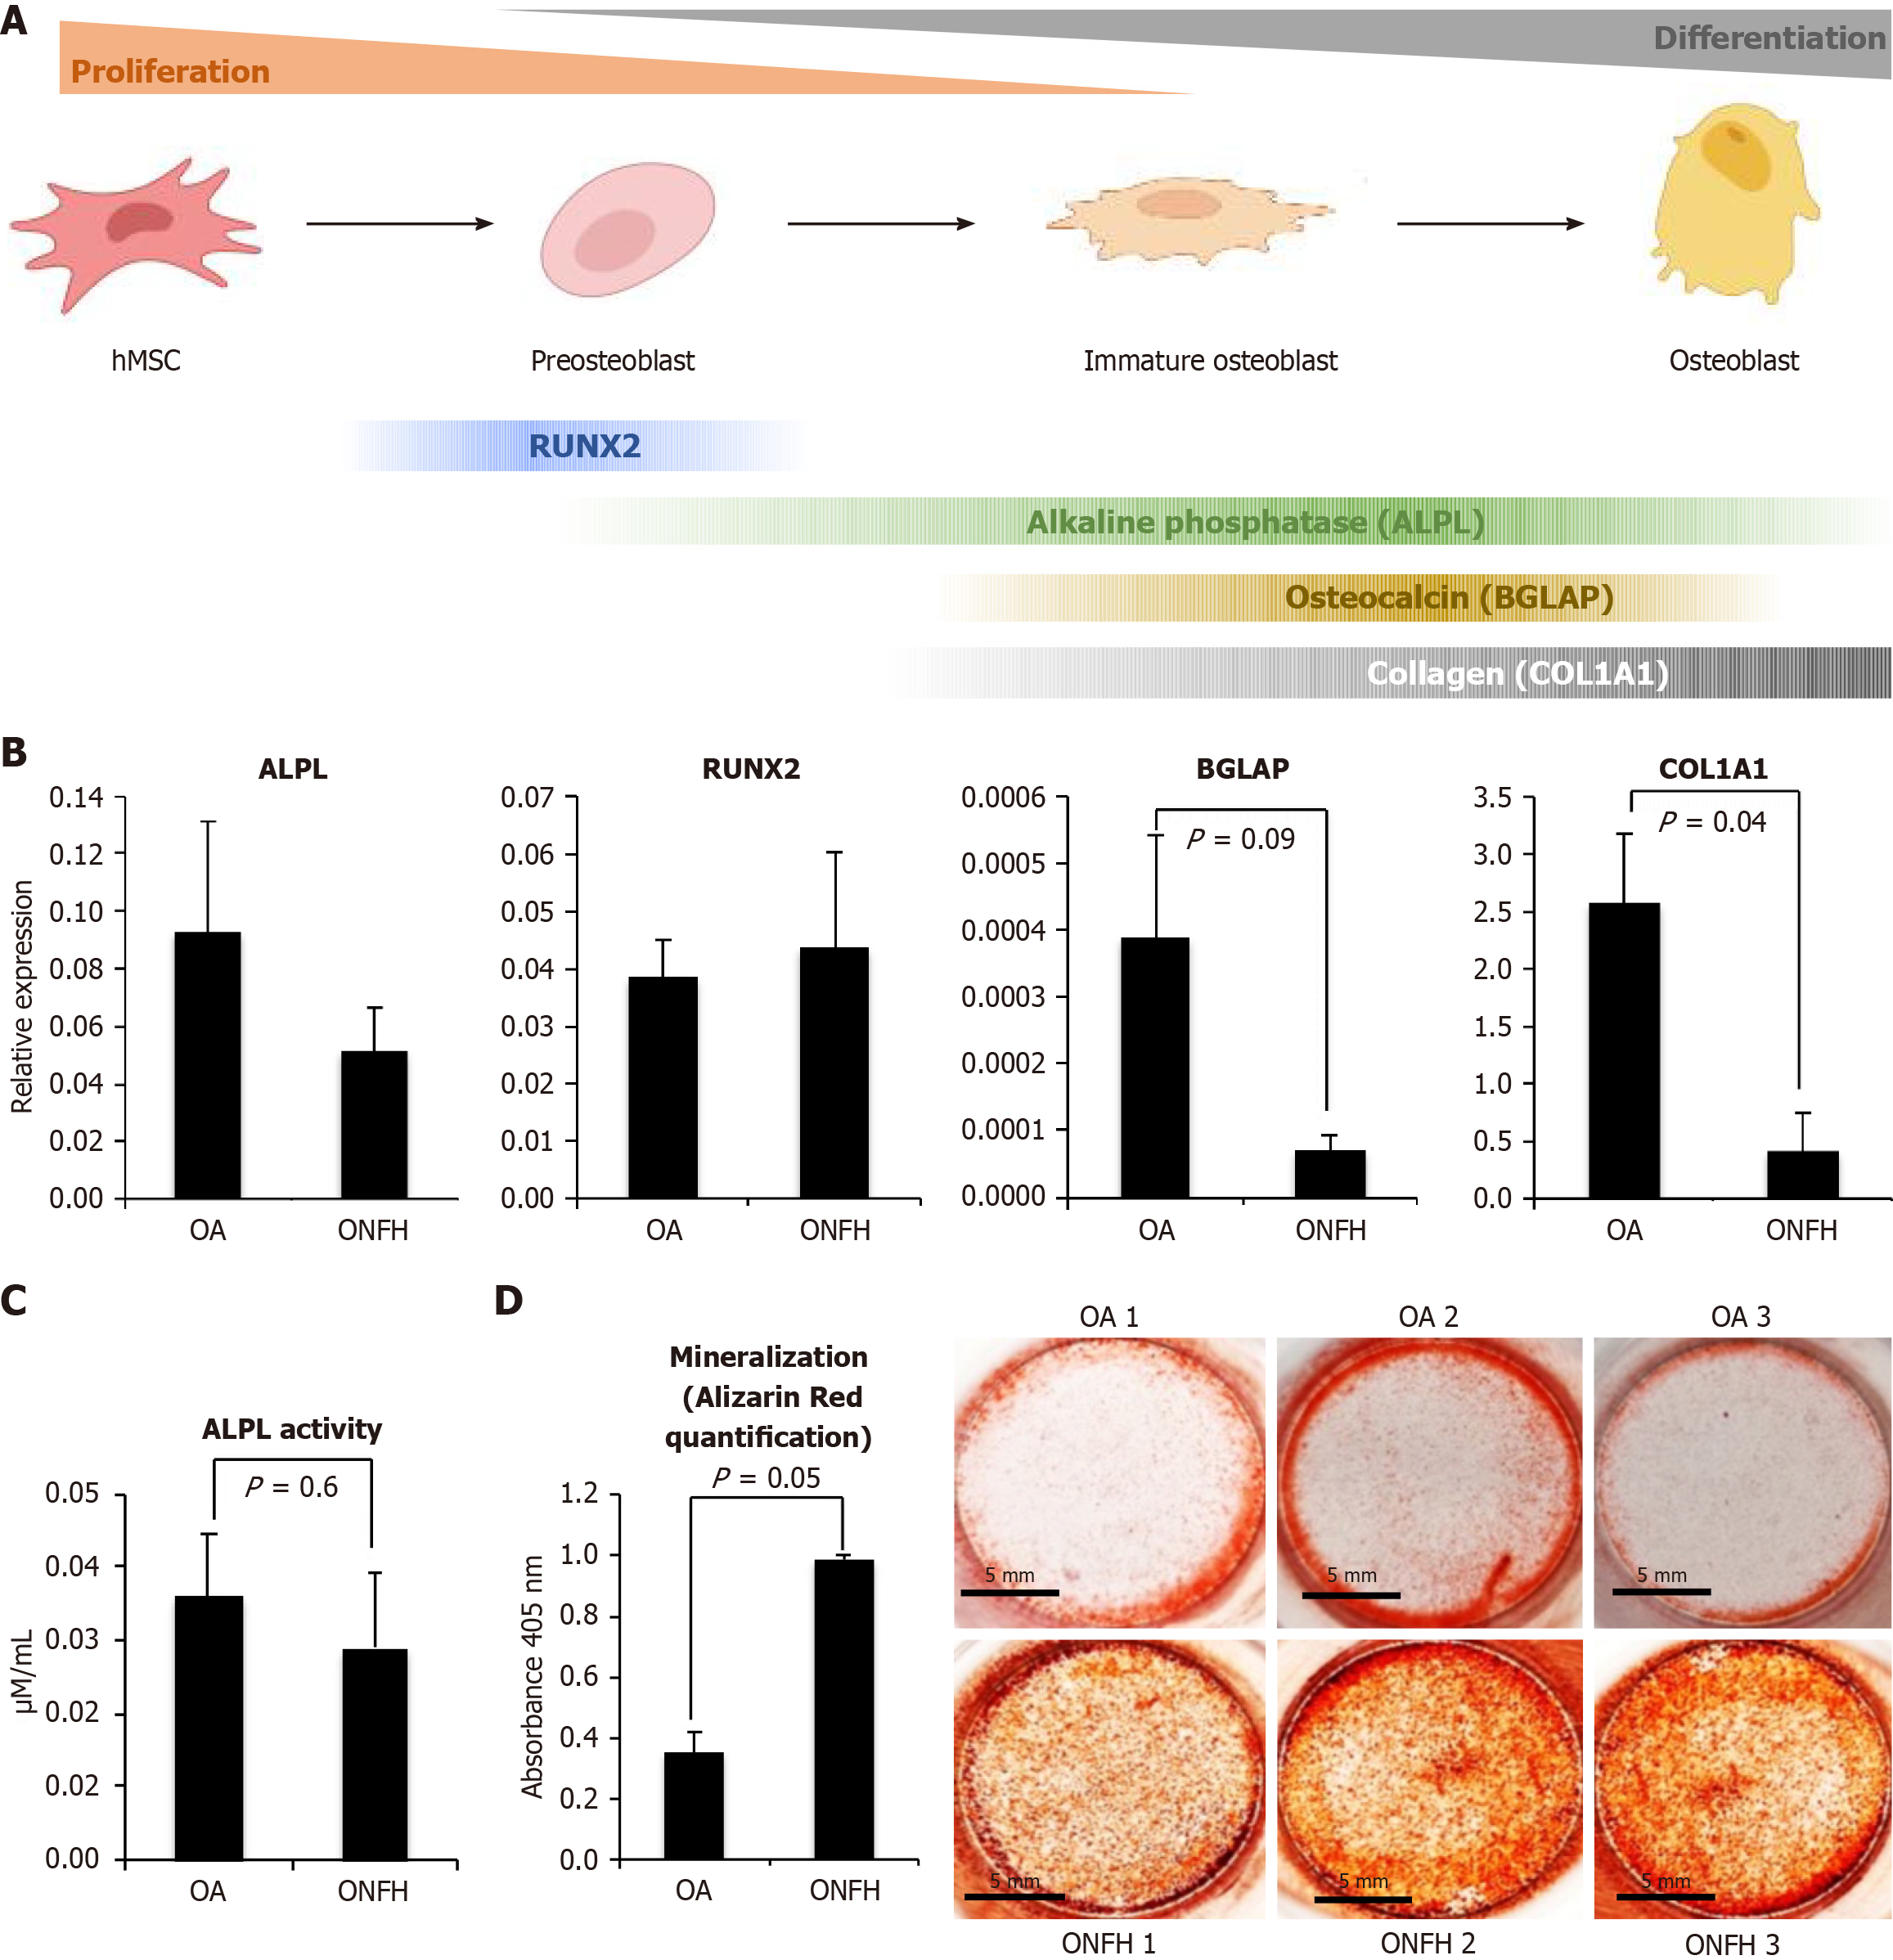
Figure 2 Osteogenic differentiation of mesenchymal stem cells derived from osteoarthritis and osteonecrosis of the femoral head patients.
Images shown on the right are representative of 6 independent samples in each group [osteoarthritis (OA), n = 6; osteonecrosis of the femoral head (ONFH), n = 6]. Identical cell confluence was verified prior to perform Alizarin Red or Oil Red stainings. Despite reduced osteogenic marker expression, ONFH MSCs showed increased Alizarin Red signal, consistent with a paradoxical mineralization phenotype Graphs display the mean ± SEM for each group Statistical significance is indicated by P values in the graphs. A: Expression of the different osteogenic markers analyzed along osteogenic differentiation; B: At day 20 of osteogenic induction, gene expression levels of RUNX2, ALPL, COL1A1, and BGLAP were quantified by quantitative polymerase chain reaction (ONFH, n = 10; OA, n = 10); C: ALPL gene expression and enzymatic activity assessed at day 20 under osteogenic conditions to confirm early differentiation events (ONFH, n = 6; OA, n = 6); D: Mineralization capacity was evaluated by measuring the intensity of Alizarin Red staining after 20 days of induction. OA: Osteoarthritis; ONFH: Osteonecrosis of the femoral head. Created with BioRender.com.
- Citation: Cardín-Pereda A, García-Sánchez D, Álvarez-Iglesias I, Cabello-Sanz J, Pérez-Campo FM. Altered lineage commitment of bone marrow mesenchymal stem cells in idiopathic osteonecrosis of the femoral head. World J Orthop 2025; 16(12): 113320
- URL: https://www.wjgnet.com/2218-5836/full/v16/i12/113320.htm
- DOI: https://dx.doi.org/10.5312/wjo.v16.i12.113320