
















©The Author(s) 2025.
World J Orthop. Nov 18, 2025; 16(11): 110716
Published online Nov 18, 2025. doi: 10.5312/wjo.v16.i11.110716
Published online Nov 18, 2025. doi: 10.5312/wjo.v16.i11.110716
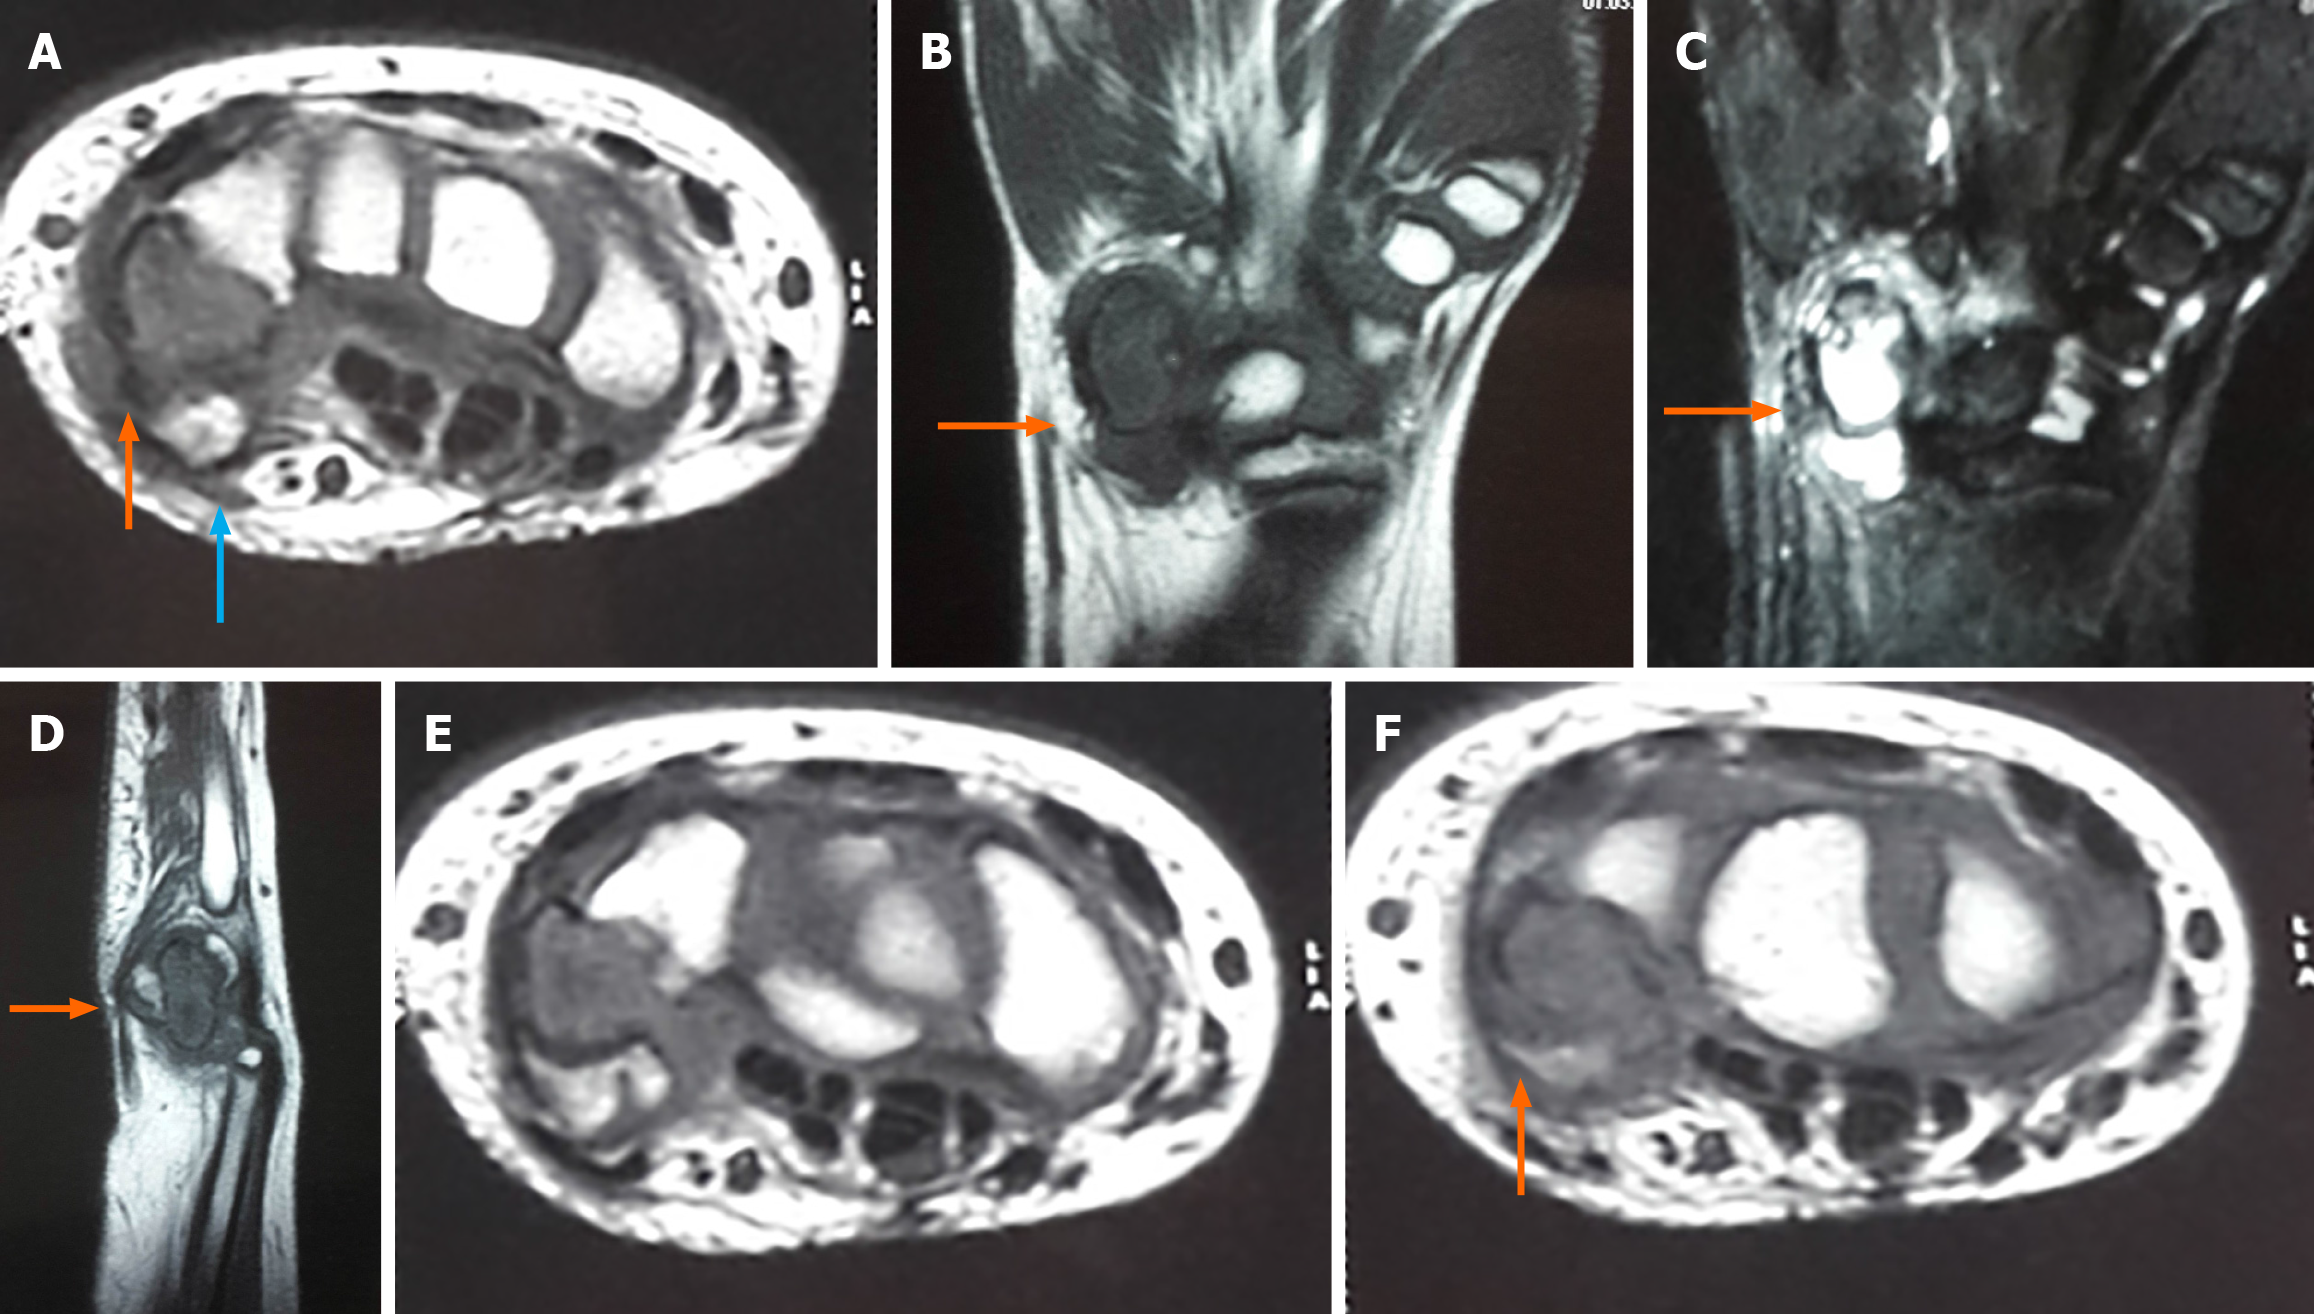
Figure 3 Magnetic resonance imaging.
A-F: T1 coronal with hyointense lesion marked (B); T2 coronal with oedema of the pisiform and triquetrum without adjacent soft tissue infiltration marked (C); T1 sagittal with hypointense lesion marked (cartilage caps are hypointense in T1) (D); T1 axial with hypointense lesion marked and ventral isointense lesion suggestive of pisiform (orange arrow) with dorsal lesion (blue arrow) (A, E and F).
- Citation: Vanapalli R, Jayant UK, Mlv SK, Rawat SS, Ansari MT. Osteochondroma of the pisiform: A case report. World J Orthop 2025; 16(11): 110716
- URL: https://www.wjgnet.com/2218-5836/full/v16/i11/110716.htm
- DOI: https://dx.doi.org/10.5312/wjo.v16.i11.110716