Copyright
©The Author(s) 2020.
World J Orthop. Dec 18, 2020; 11(12): 584-594
Published online Dec 18, 2020. doi: 10.5312/wjo.v11.i12.584
Published online Dec 18, 2020. doi: 10.5312/wjo.v11.i12.584
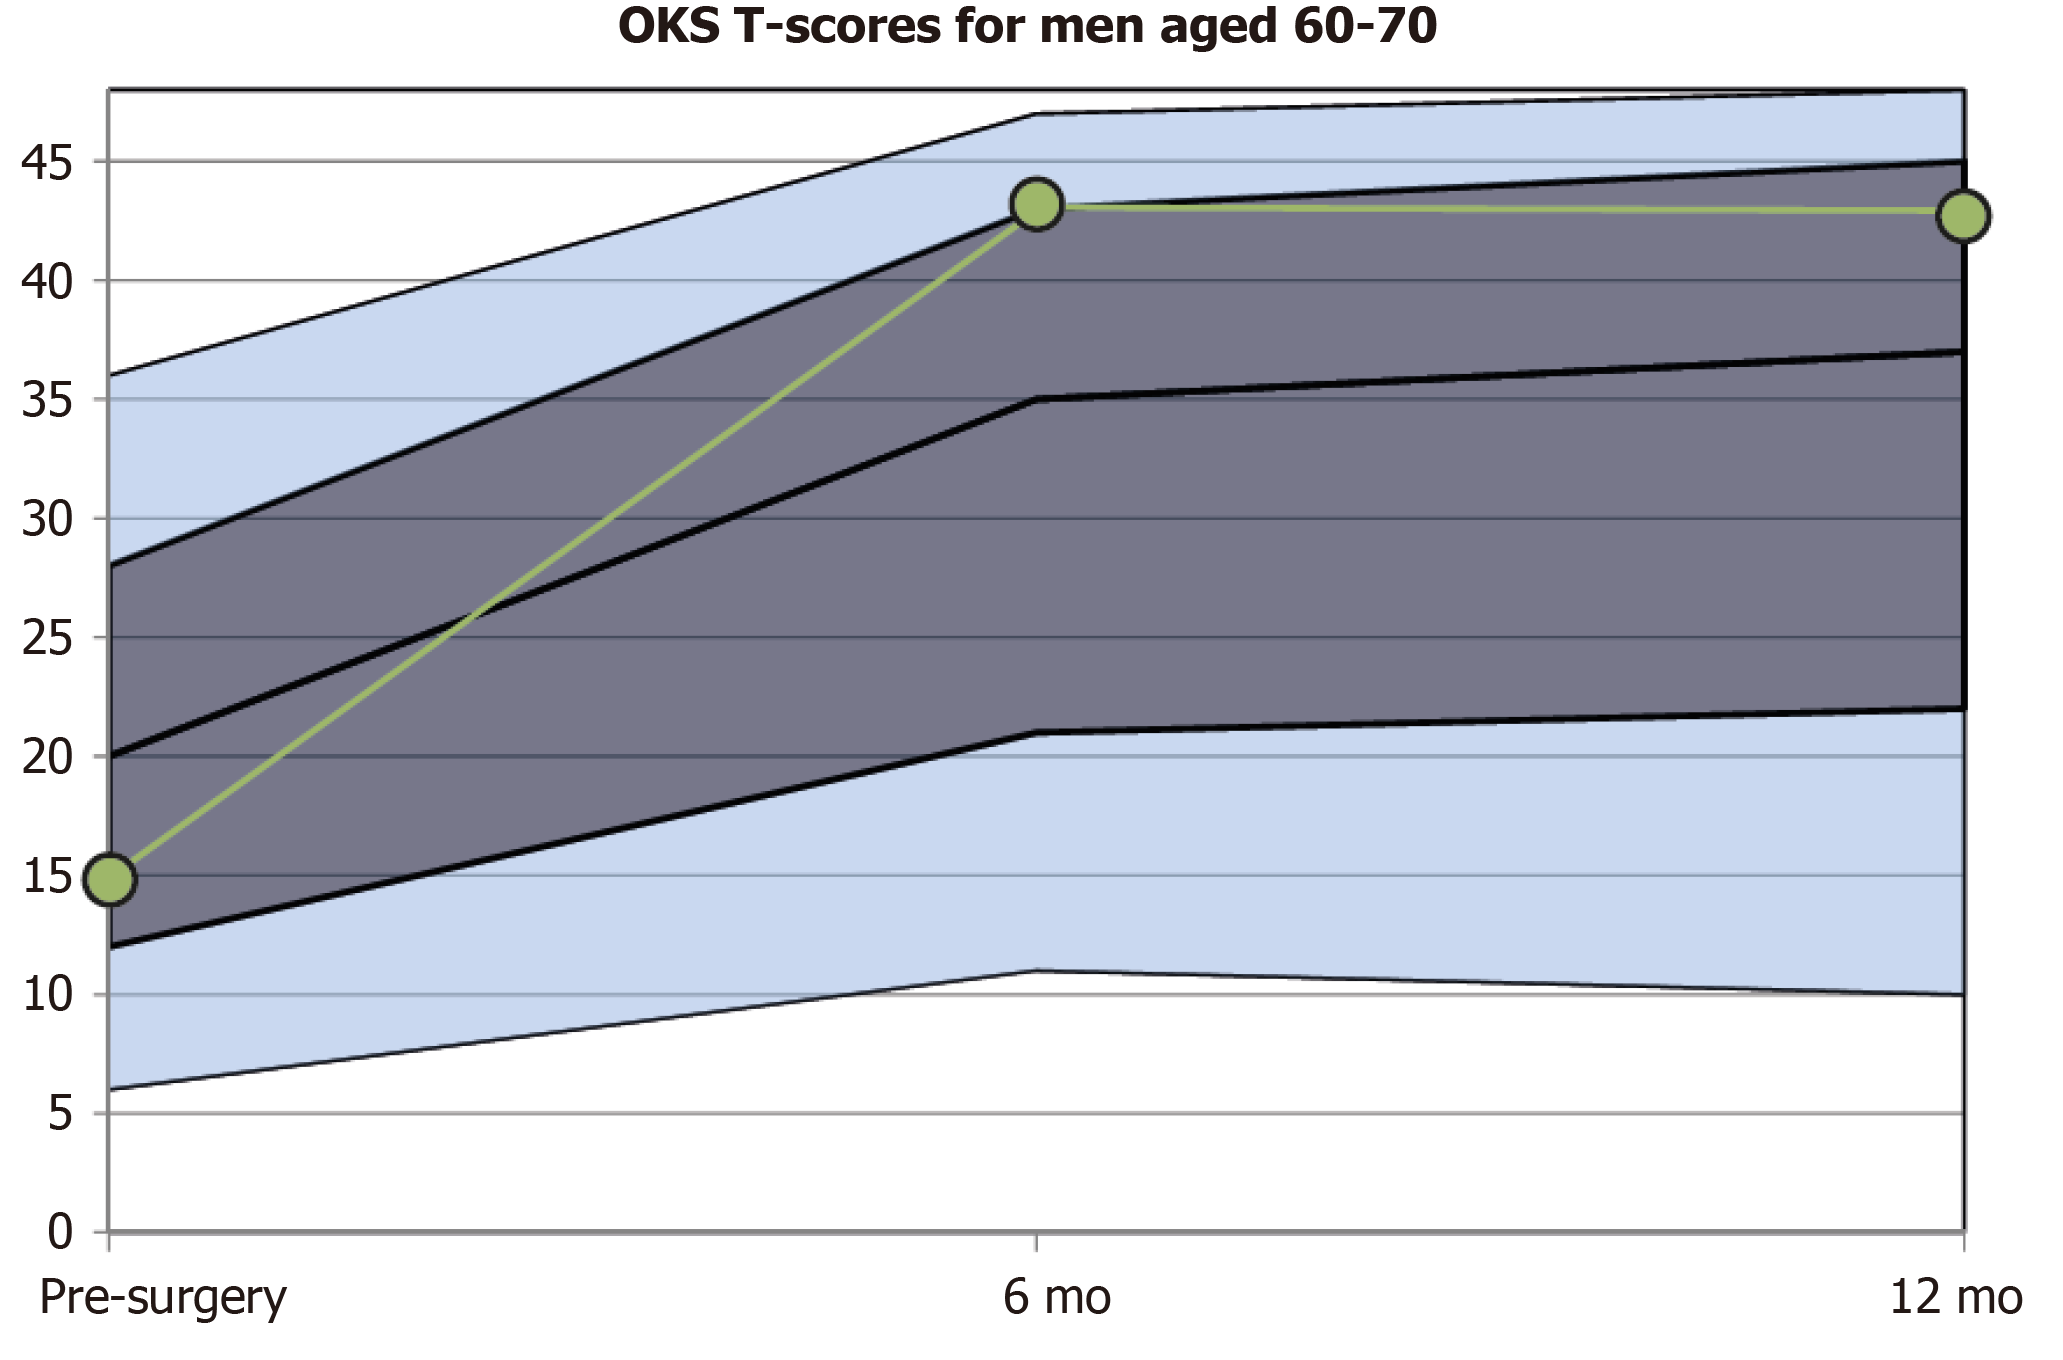
Figure 3 OKS T-scores feedback model stratified to patient demographics.
Figure showing the longitudinal course of expected patient outcomes. The exemplary course (green line) of an individual patient undergoing total knee arthroplasty at 3 different points prior to and following surgery is presented in terms of t-scores against a background of an age and gender matched population. The dark grey area is the range for +/- 1 standard deviation of the appropriate matched population and the light grey area the range for +/- 2 standard deviation.
- Citation: Hamilton DF, Giesinger JM, Giesinger K. Technological developments enable measuring and using patient-reported outcomes data in orthopaedic clinical practice. World J Orthop 2020; 11(12): 584-594
- URL: https://www.wjgnet.com/2218-5836/full/v11/i12/584.htm
- DOI: https://dx.doi.org/10.5312/wjo.v11.i12.584


