Copyright
©The Author(s) 2019.
World J Orthop. Sep 18, 2019; 10(9): 310-326
Published online Sep 18, 2019. doi: 10.5312/wjo.v10.i9.310
Published online Sep 18, 2019. doi: 10.5312/wjo.v10.i9.310
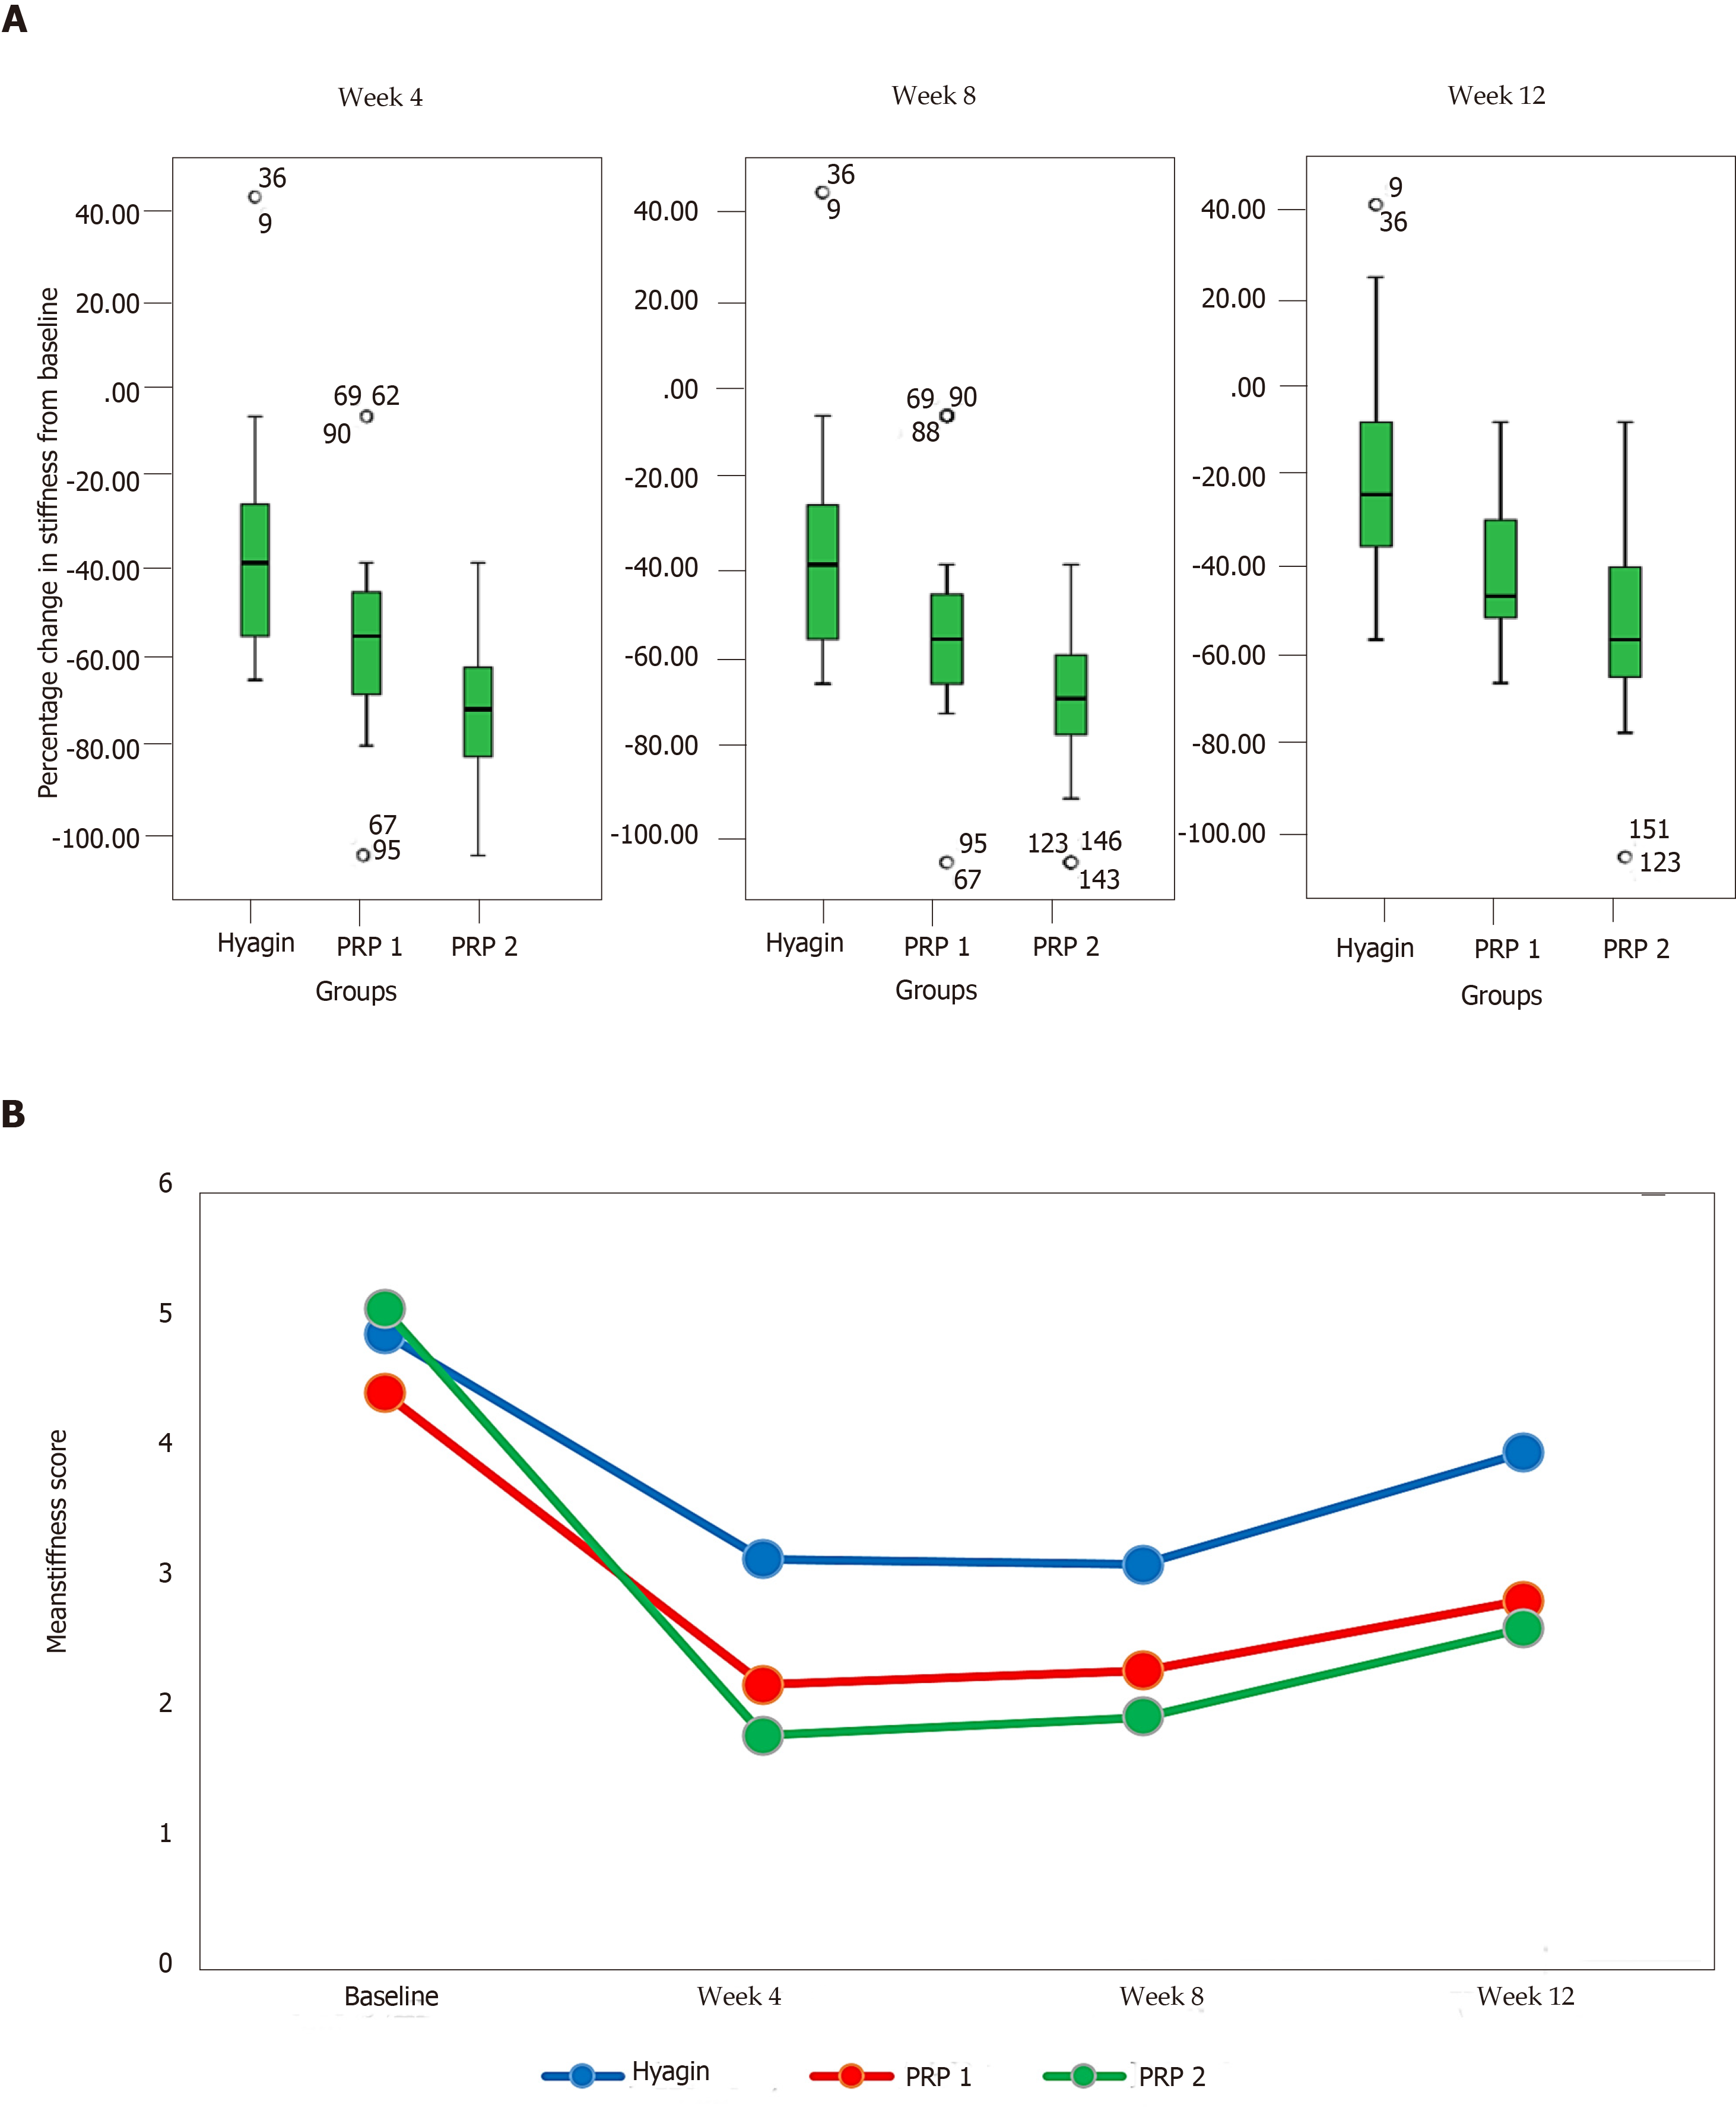
Figure 3 Comparison of the stiffness score indices between the three intervention groups at baseline and subsequent follow-ups.
A: Comparison of the percentage change in stiffness from baseline to wk 4 (1st follow-up), wk 8 (2nd follow-up), and wk 12 (3rd follow-up) between the three groups; B: Comparison of the mean stiffness scores at baseline and subsequent follow-ups between the three groups. Negative shows a benefit from pre-treatment values.
- Citation: Tavassoli M, Janmohammadi N, Hosseini A, Khafri S, Esmaeilnejad-Ganji SM. Single- and double-dose of platelet-rich plasma versus hyaluronic acid for treatment of knee osteoarthritis: A randomized controlled trial. World J Orthop 2019; 10(9): 310-326
- URL: https://www.wjgnet.com/2218-5836/full/v10/i9/310.htm
- DOI: https://dx.doi.org/10.5312/wjo.v10.i9.310


