Copyright
©The Author(s) 2019.
World J Orthop. May 18, 2019; 10(5): 219-227
Published online May 18, 2019. doi: 10.5312/wjo.v10.i5.219
Published online May 18, 2019. doi: 10.5312/wjo.v10.i5.219
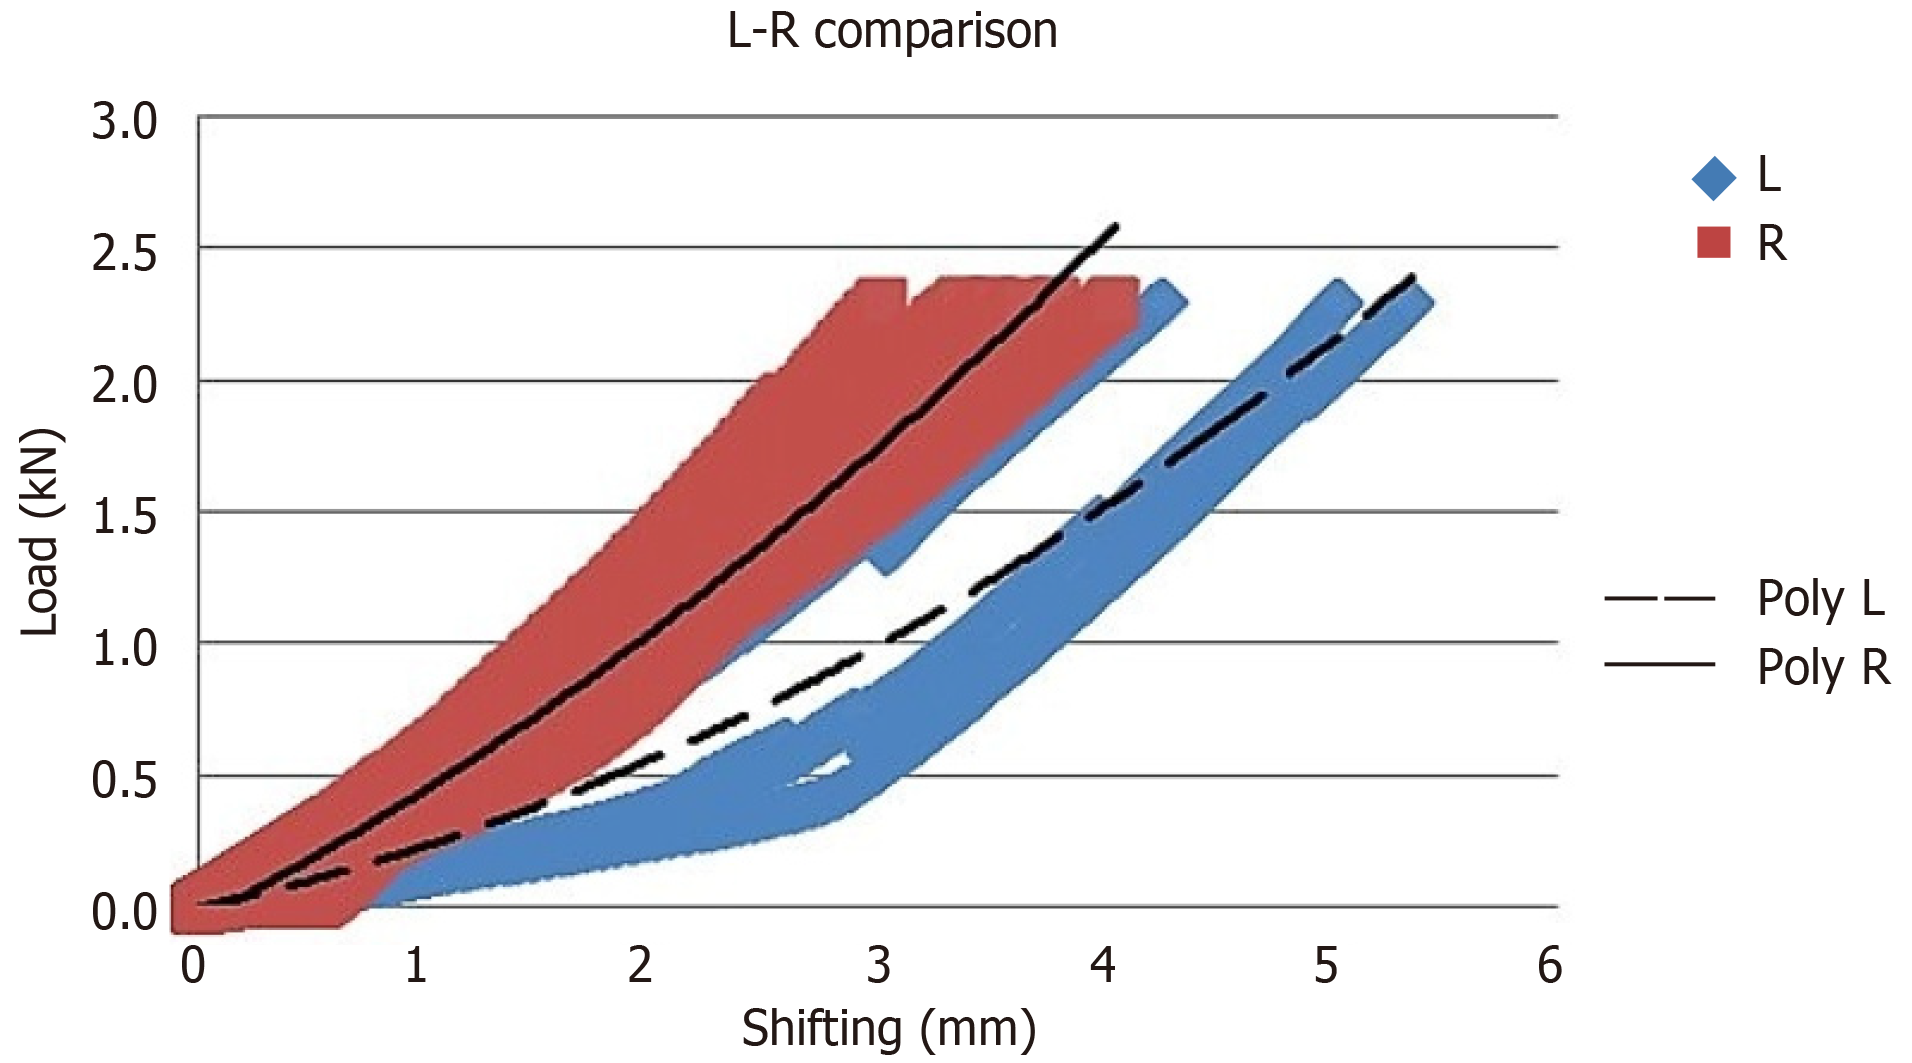
Figure 4 Comparison of distribution graphs for the conventional curved reconstruction plate and precontoured anatomical buttress plate.
The slope of the linear part of the graph represents stiffness. L: Left hemipelvis model fixated with precontoured anatomical buttress plate; R: Right hemipelvis model fixated with conventional curved reconstruction plate.
- Citation: Altun G, Saka G, Demir T, Elibol FKE, Polat MO. Precontoured buttress plate vs reconstruction plate for acetabulum posterior wall fractures: A biomechanical study. World J Orthop 2019; 10(5): 219-227
- URL: https://www.wjgnet.com/2218-5836/full/v10/i5/219.htm
- DOI: https://dx.doi.org/10.5312/wjo.v10.i5.219


