Copyright
©The Author(s) 2017.
World J Orthop. Nov 18, 2017; 8(11): 815-828
Published online Nov 18, 2017. doi: 10.5312/wjo.v8.i11.815
Published online Nov 18, 2017. doi: 10.5312/wjo.v8.i11.815
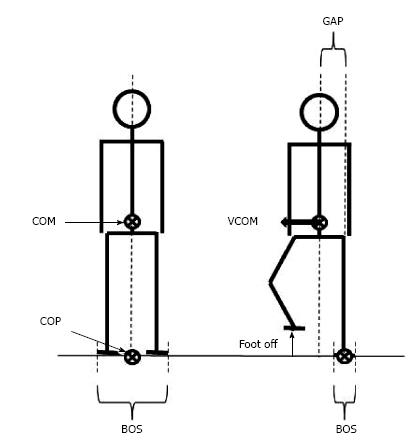
Figure 1 Representation of selected basic notions for balance analysis in biomechanics.
Note that in the quiet standing posture (left figure), the vertical projection of the COM onto the ground falls on the COP. When the subject lifts the foot to step forward (right figure), the base of support size is drastically reduced. A gap between the COP and the COM may then occur, thus causing a disequilibrium towards the stance leg. COM: Center of mass; COP: Center of pressure; BOS: Base of support; VCOM: COM velocity.
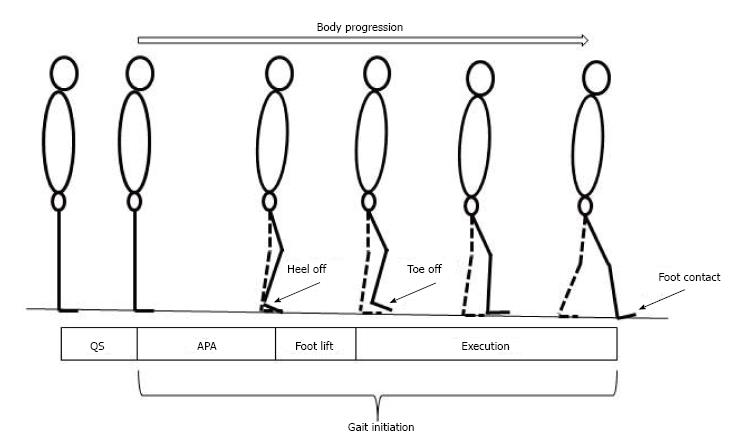
Figure 2 Stick representation of the different phases and temporal events of gait initiation.
APA: Anticipatory postural adjustments.
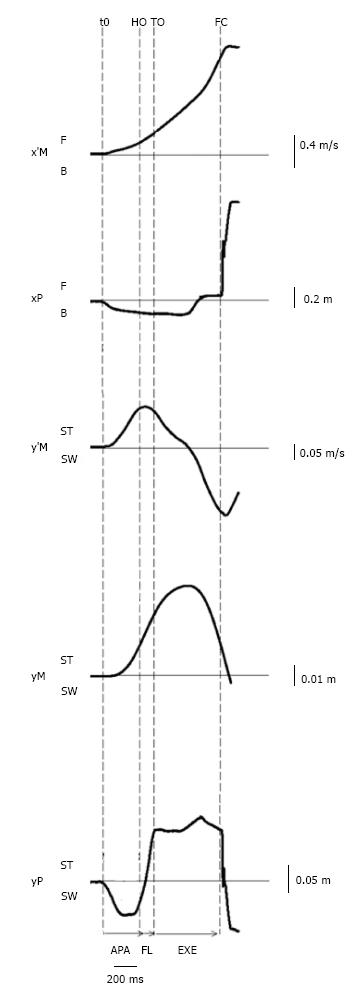
Figure 3 Example of biomechanical traces obtained for one representative subject initiating gait at a maximal velocity (one trial).
Anteroposterior direction x’M: center of mass (COM) velocity; xP: Center of pressure (COP) displacement; F: Forward; B: Backward. Mediolateral direction y’M: Mediolateral COM velocity; yM: Mediolateral COM displacement; yP: Mediolateral COP displacement; ST: Stance limb; SW: Swing limb. Vertical dashed lines: t0 onset variation of biomechanical traces; HO: Swing heel off; FO: Swing foot off; FC: Swing foot contact. Horizontal arrows: APA: Anticipatory postural adjustments; FL: Foot lift; EXE: Execution phase.
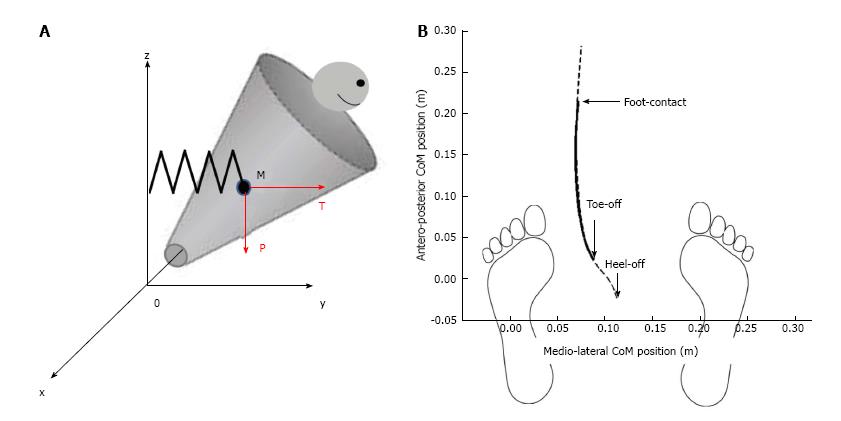
Figure 4 Mechanical model of the body during the execution phase of gait initiation.
A: The mechanical model is represented as conic inverted pendulum which pivots around fixed point 0. Body displacement presents five degrees of freedom. The center of mass M falls under the influence of the gravity force “P” and the elastic restoring force “T”; B: Anteroposterior vs mediolateral path of the center of gravity. Dash line represents experimental data during the whole trial and full line represents theoretical data during the execution phase of gait initiation. Note the excellent fitting between these two traces.
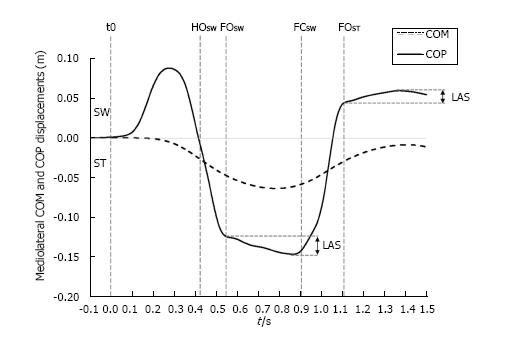
Figure 5 Typical time course of the center of mass and the center of pressure along the mediolateral direction during gait initiation.
The traces were obtained for one subject initiating gait at self-selected speed (one trial). SW and ST indicate swing limb and stance limb, respectively. t0, HOSW, FOSW, FCSW, FOST: Onset variation of biomechanical traces, swing heel-off, swing foot off, swing foot contact, stance foot off, respectively. LAS indicates “lateral ankle strategy”. The extent of the corrections achievable by this strategy may be appreciated by the difference between both the initial and the maximum lateral positions of the COP during the single support phase. COM: Center of mass; COP: Center of pressure.
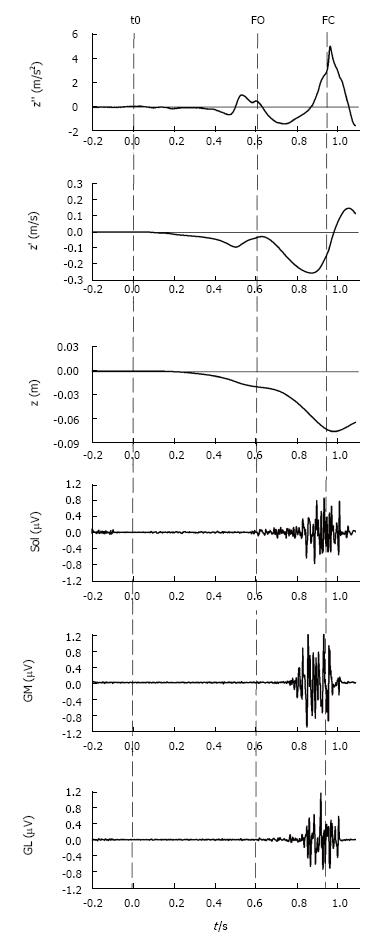
Figure 6 Vertical braking of center of mass during gait initiation.
This figure shows, from top to bottom, the timelines of the COM vertical acceleration (z’’), COM vertical velocity (z’), COM vertical position (z) as well as the electromyographical activity of stance leg triceps surae activity, i.e., soleus (Sol), gastrocnemius medialis (GM) and gastrocnemius lateralis (GL) of a single recording during gait initiation. The dashed lines indicate the instants of initiation (t0), foot off (FO) and foot contact (FC). As can be seen in the figure, step execution is accompanied by a downward (negative) COM acceleration. During mid-single stance, triceps surae activity counteracts gravity and brakes the vertical fall of COM. The braking action of COM is observable as a positive acceleration (top panel) which causes the vertical absolute velocity at foot contact to be lower than the peak absolute velocity measured in mid-single stance. COM: Center of mass.
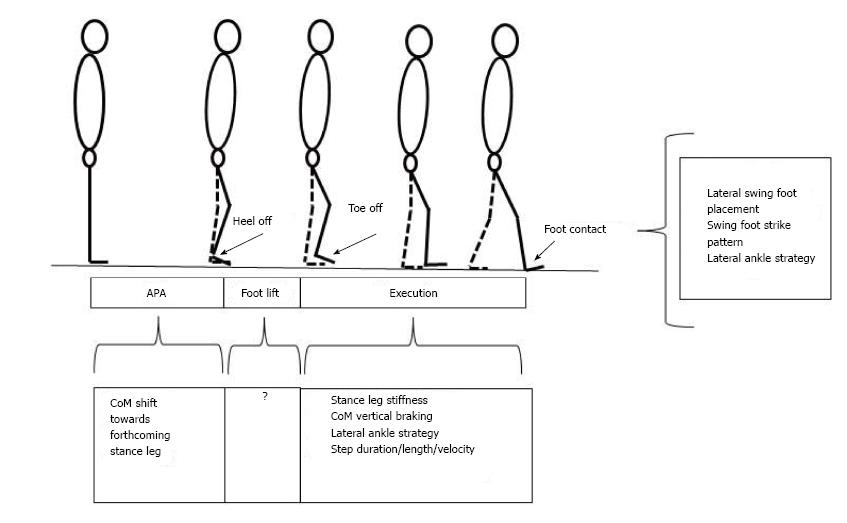
Figure 7 Synthesis of balance control mechanisms into play during gait initiation.
The coordination between these different mechanisms remains to be elucidated.
- Citation: Yiou E, Caderby T, Delafontaine A, Fourcade P, Honeine JL. Balance control during gait initiation: State-of-the-art and research perspectives. World J Orthop 2017; 8(11): 815-828
- URL: https://www.wjgnet.com/2218-5836/full/v8/i11/815.htm
- DOI: https://dx.doi.org/10.5312/wjo.v8.i11.815


