Copyright
©The Author(s) 2023.
World J Orthop. Mar 18, 2023; 14(3): 146-154
Published online Mar 18, 2023. doi: 10.5312/wjo.v14.i3.146
Published online Mar 18, 2023. doi: 10.5312/wjo.v14.i3.146
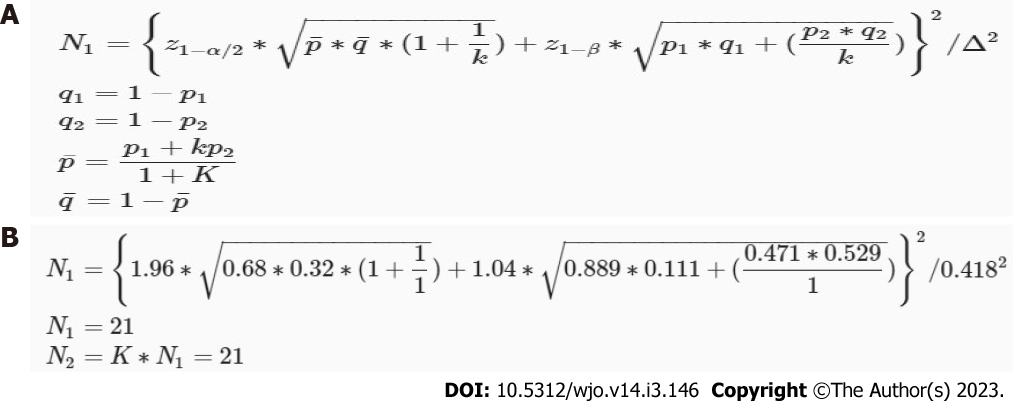
Figure 1 Minimum sample size calculation.
A: Formula; B: Calculation process for this study. p1, p2: Proportion (incidence) of groups #1 and #2; Δ = |p2-p1| = absolute difference between two proportions; n1: Sample size for group #1; n2: Sample size for group #2; α: Probability of type I error; β: Probability of type II error; z: Critical Z value for a given α or β; K: Ratio of sample size for group #2 to group #1.
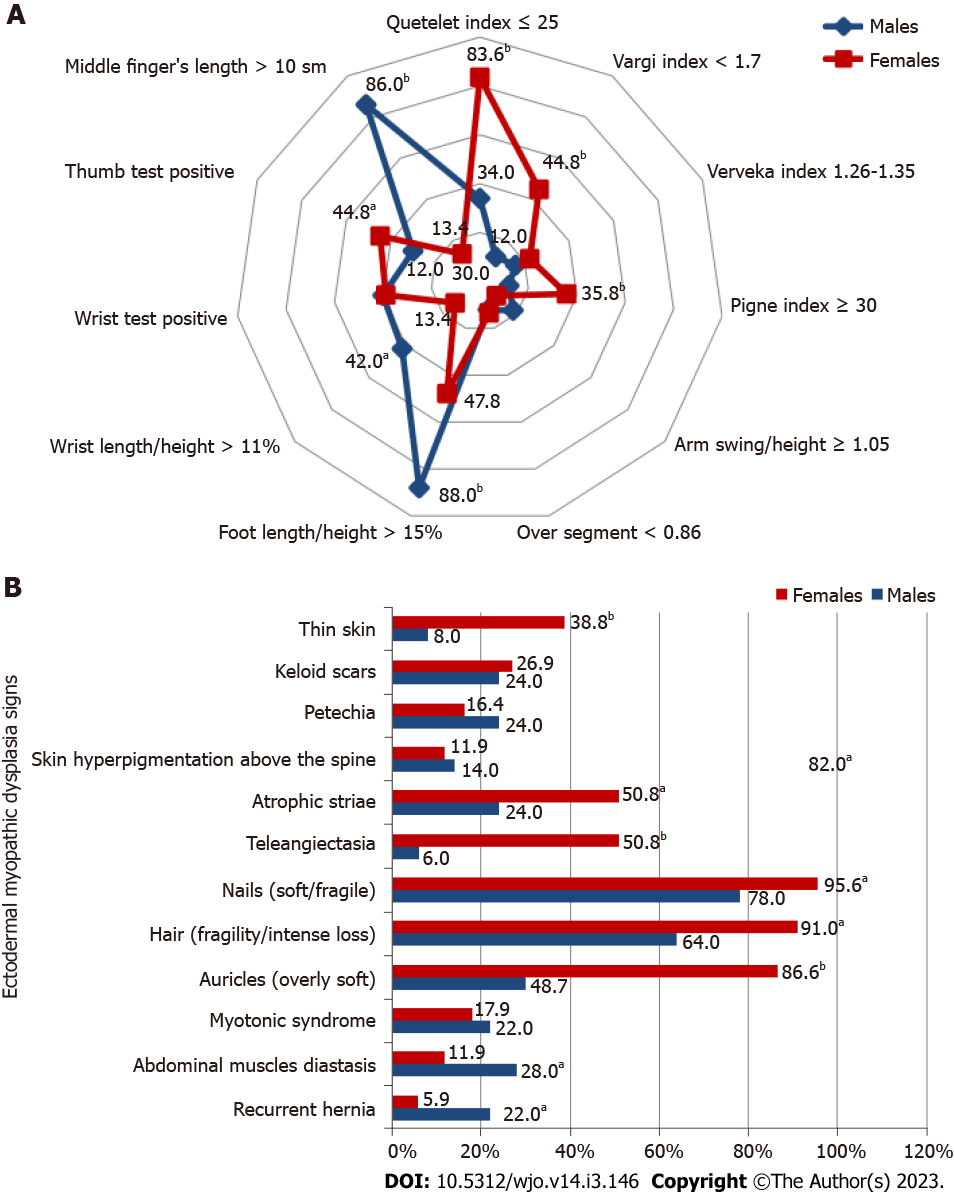
Figure 2 Body proportionality assessment, ectodermal and myopathic sign assessment in persons with musculoskeletal reinjuries.
A: Body proportionality assessment; B: Ectodermal and myopathic sign assessment. aP < 0.05, the differences are significant; bP < 0.001, the differences are highly significant.
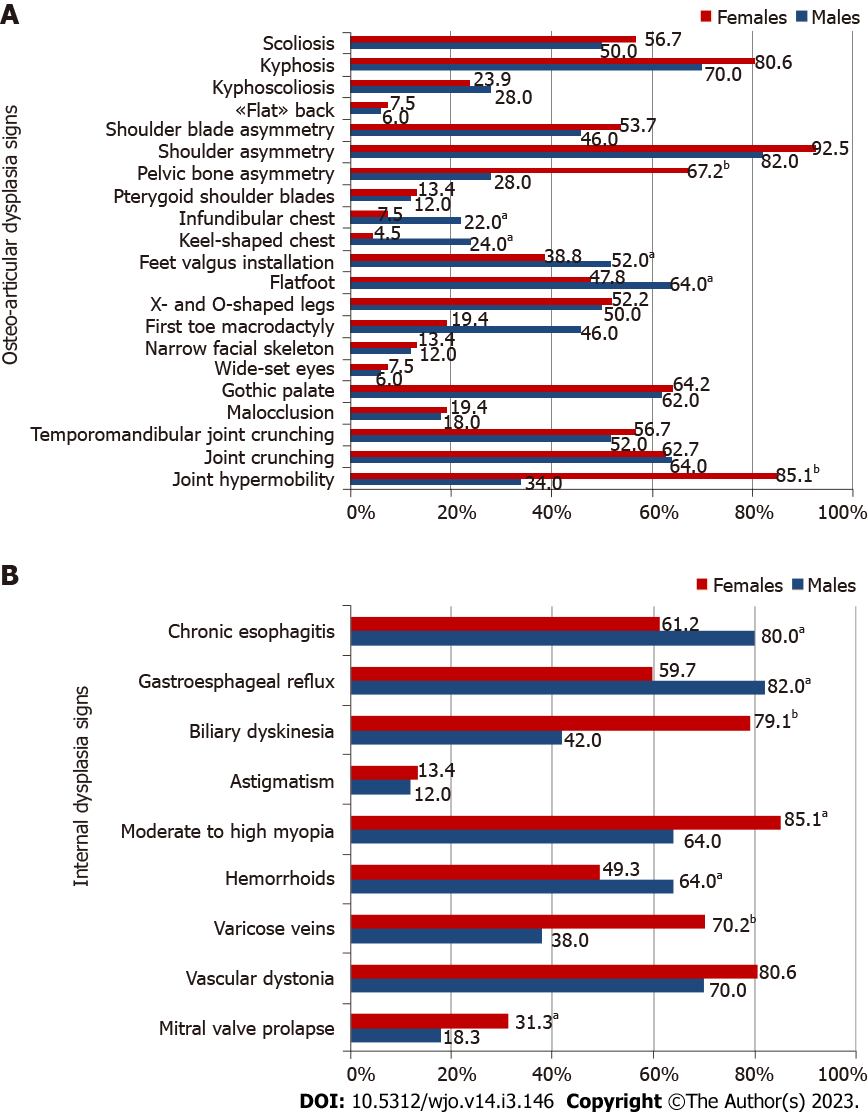
Figure 3 Assessment of osteoarticular dysplasia signs and internal dysplasia signs in persons with musculoskeletal reinjuries.
A: Assessment of osteoarticular dysplasia signs; B: Assessment of internal dysplasia signs. aP < 0.05, the differences are significant; bP < 0.001, the differences are highly significant.
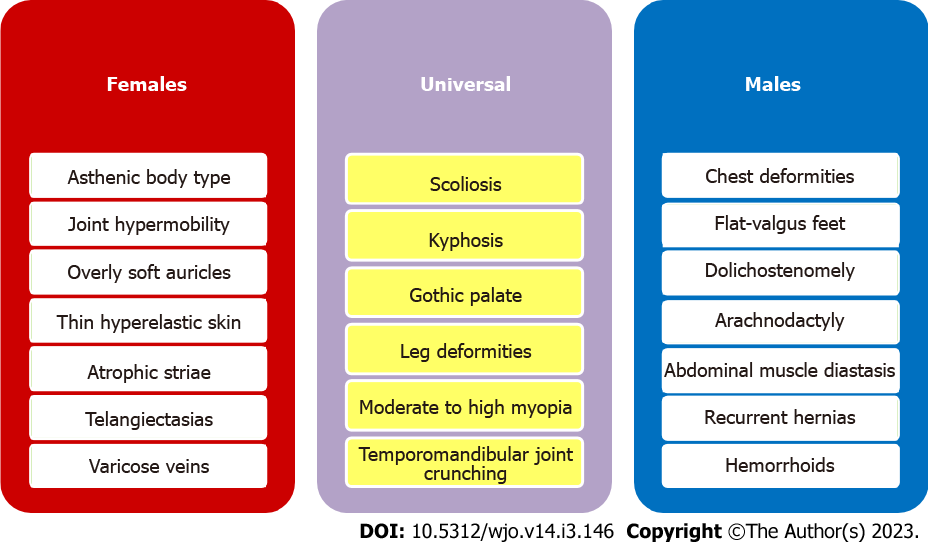
Figure 4 Pathognomonic sex-specific and universal injury predictors.
- Citation: Sankova MV, Nikolenko VN, Oganesyan MV, Vovkogon AD, Gadzhiakhmedova AN, Zharikova TS, Zharikov YO. Identifying sex-specific injury predictors as a key factor in maintaining optimal physical activity levels. World J Orthop 2023; 14(3): 146-154
- URL: https://www.wjgnet.com/2218-5836/full/v14/i3/146.htm
- DOI: https://dx.doi.org/10.5312/wjo.v14.i3.146


