Copyright
©The Author(s) 2022.
World J Orthop. Mar 18, 2022; 13(3): 307-328
Published online Mar 18, 2022. doi: 10.5312/wjo.v13.i3.307
Published online Mar 18, 2022. doi: 10.5312/wjo.v13.i3.307
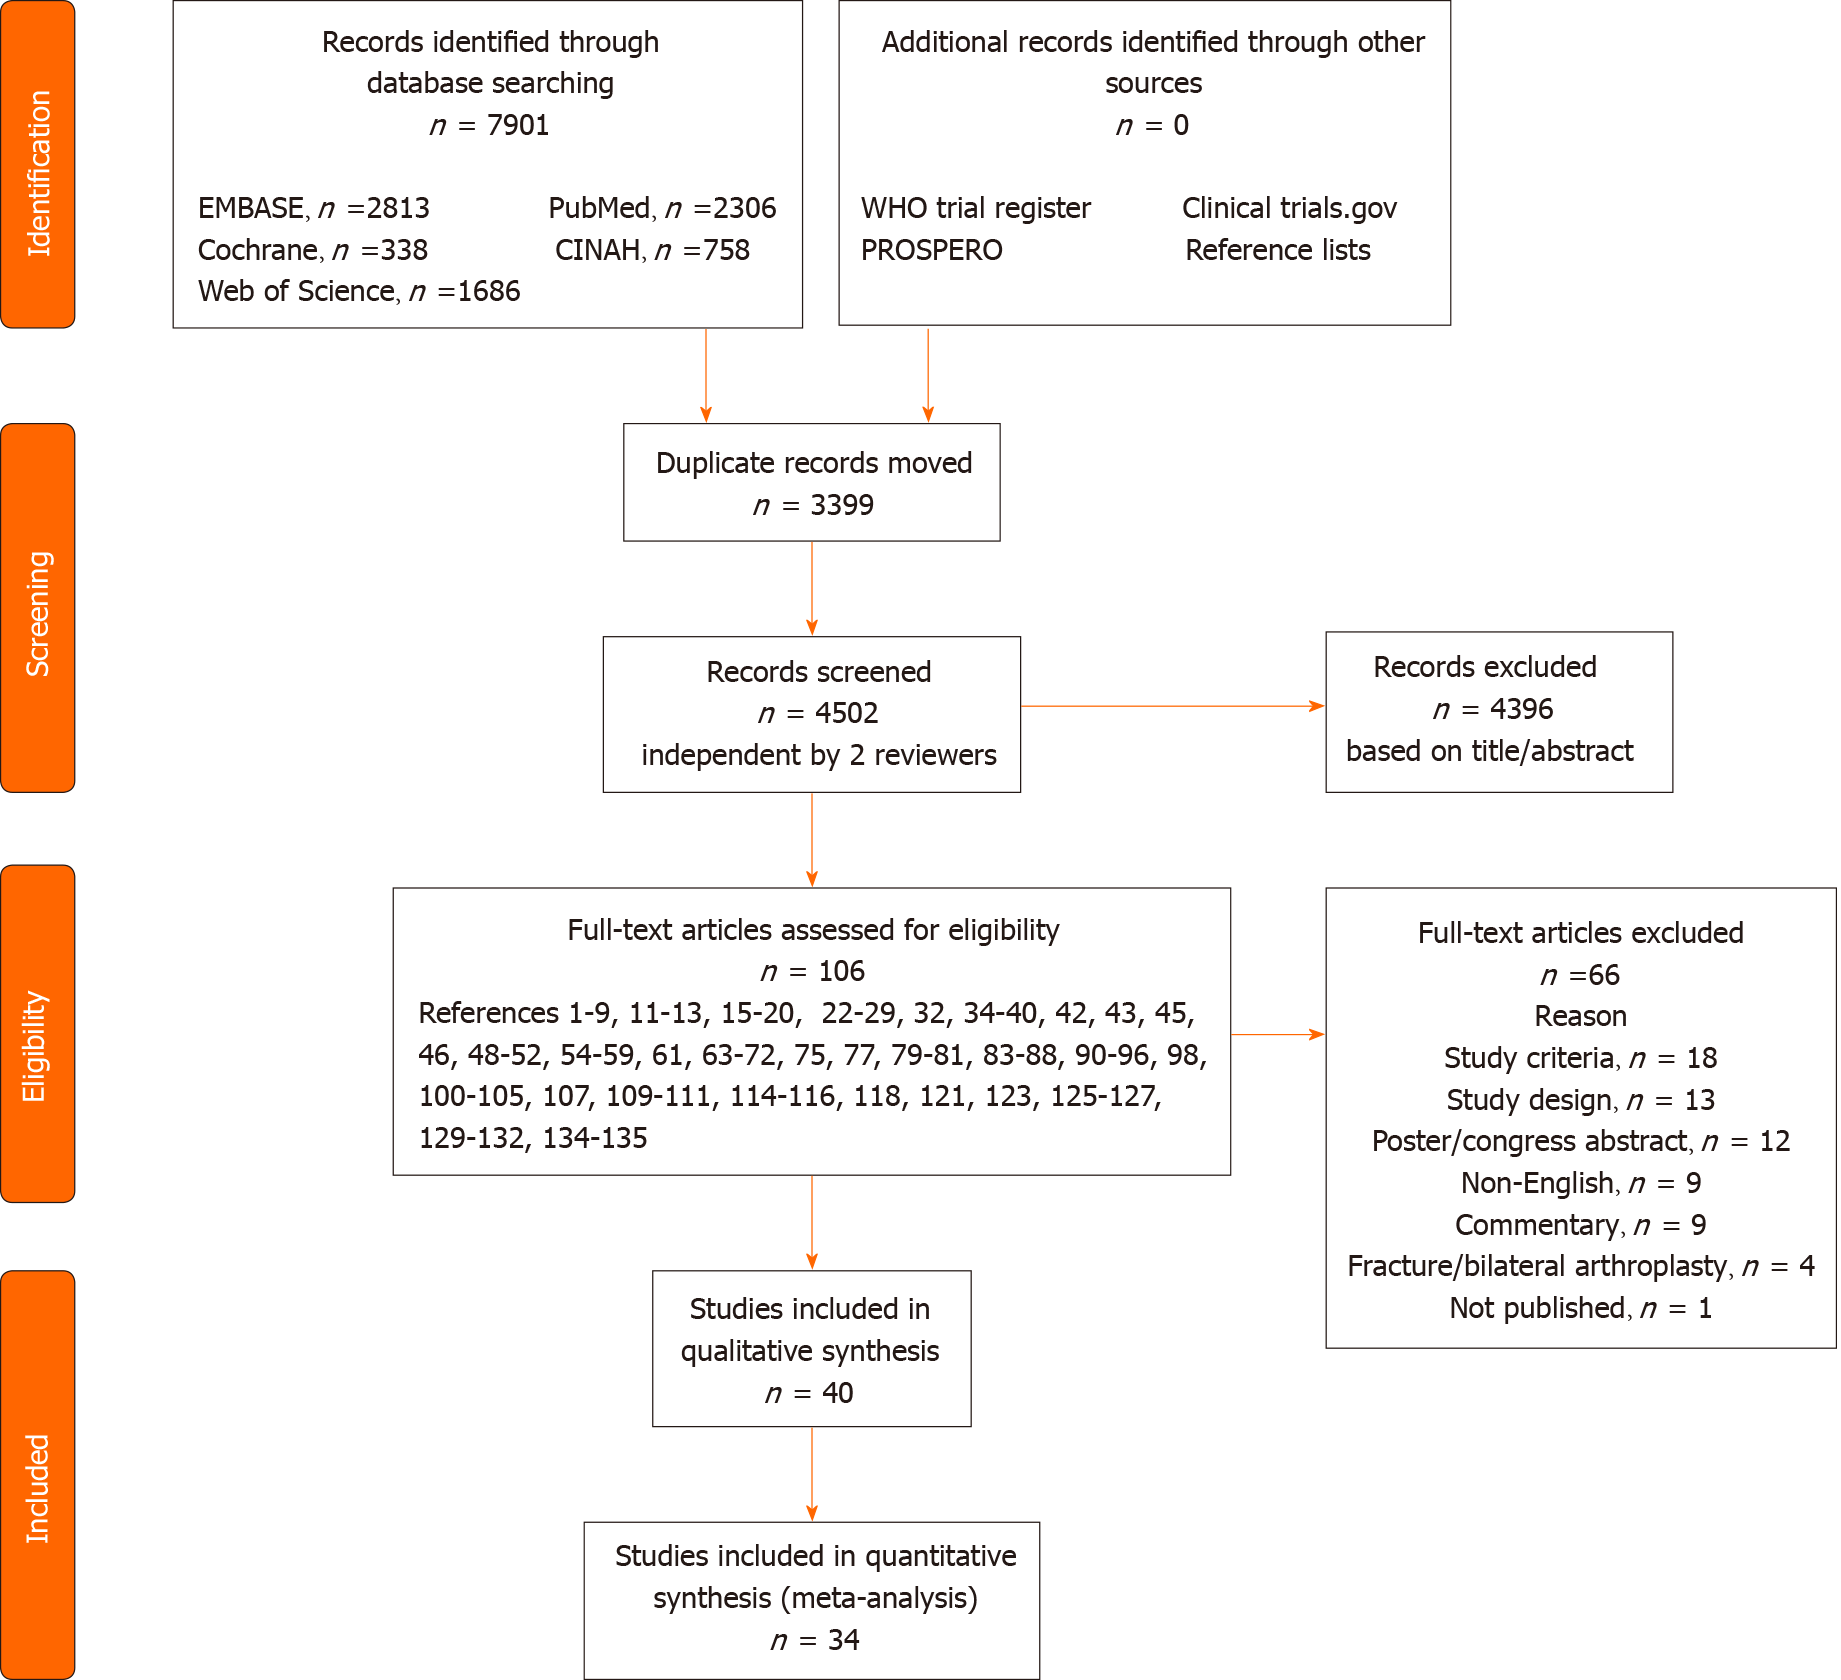
Figure 1 Flow diagram of the literature search and selection procedure.
WHO: World Health Organization.
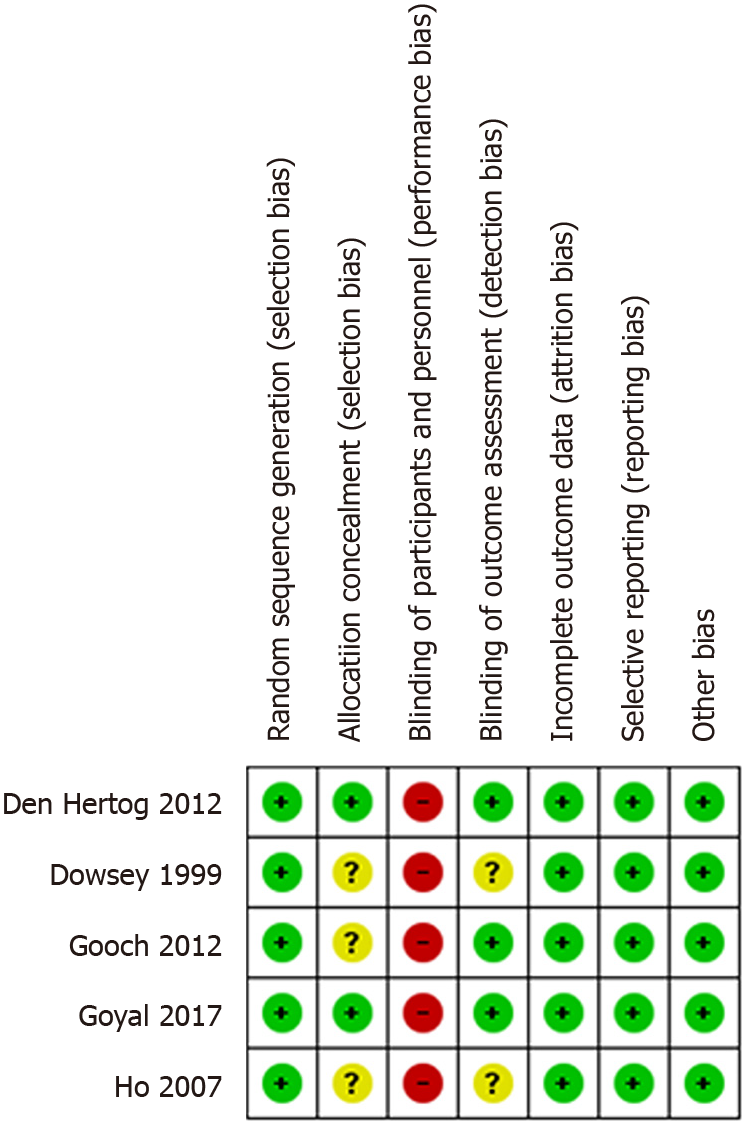
Figure 2 Cochrane risk of bias summary of the randomized controlled trials.
Review authors’ judgements about each risk of bias item. Low RoB (green + symbol), high RoB (red - symbol), or unclear RoB (yellow - symbol) is shown.
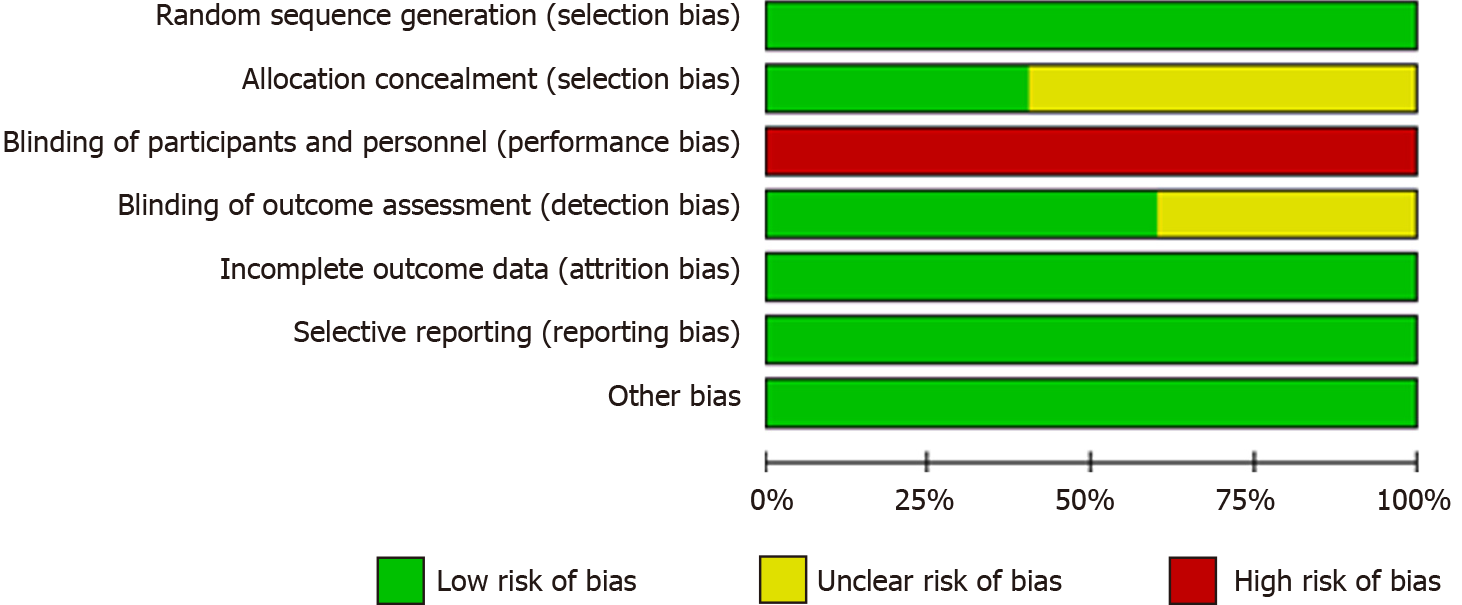
Figure 3 Cochrane RoB graph: Review authors' judgements about each risk of bias item presented as percentages across all included randomized studies.
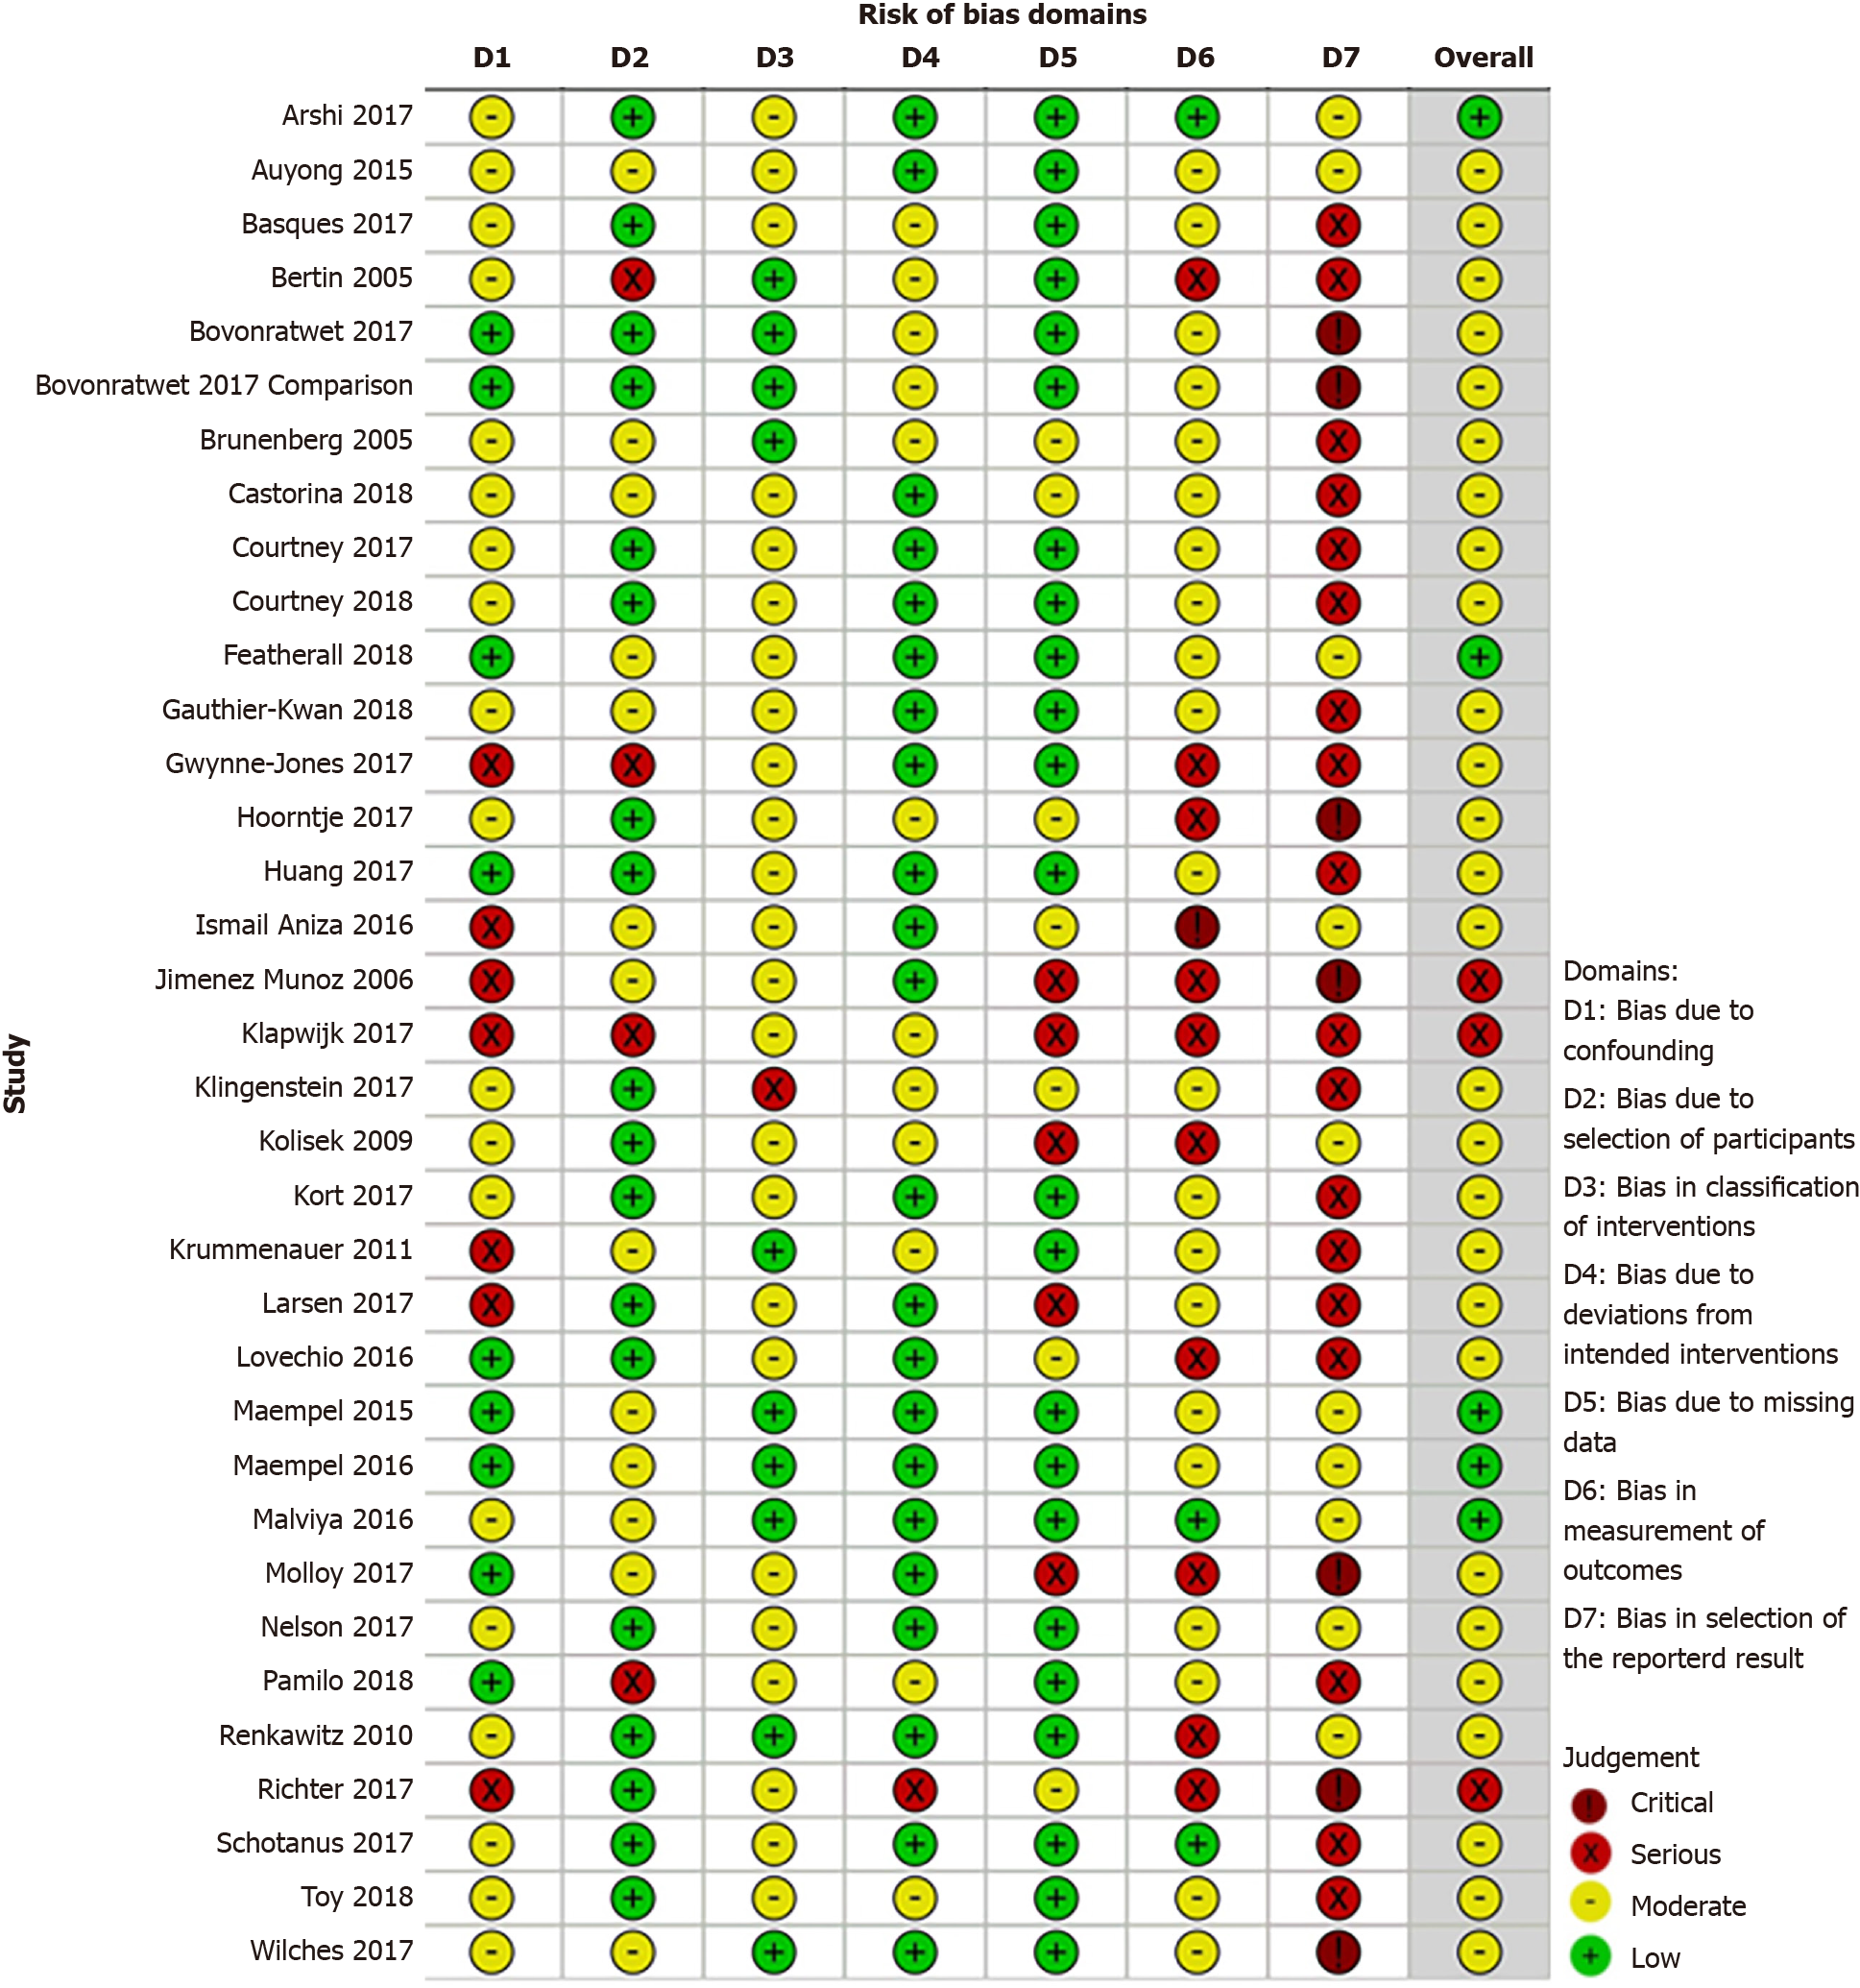
Figure 4 ROBINS-I bias assessment of the non-randomized studies.
Review authors' judgements about each risk of bias domain.
Figure 5 ROBINS-I weighted summary plot.
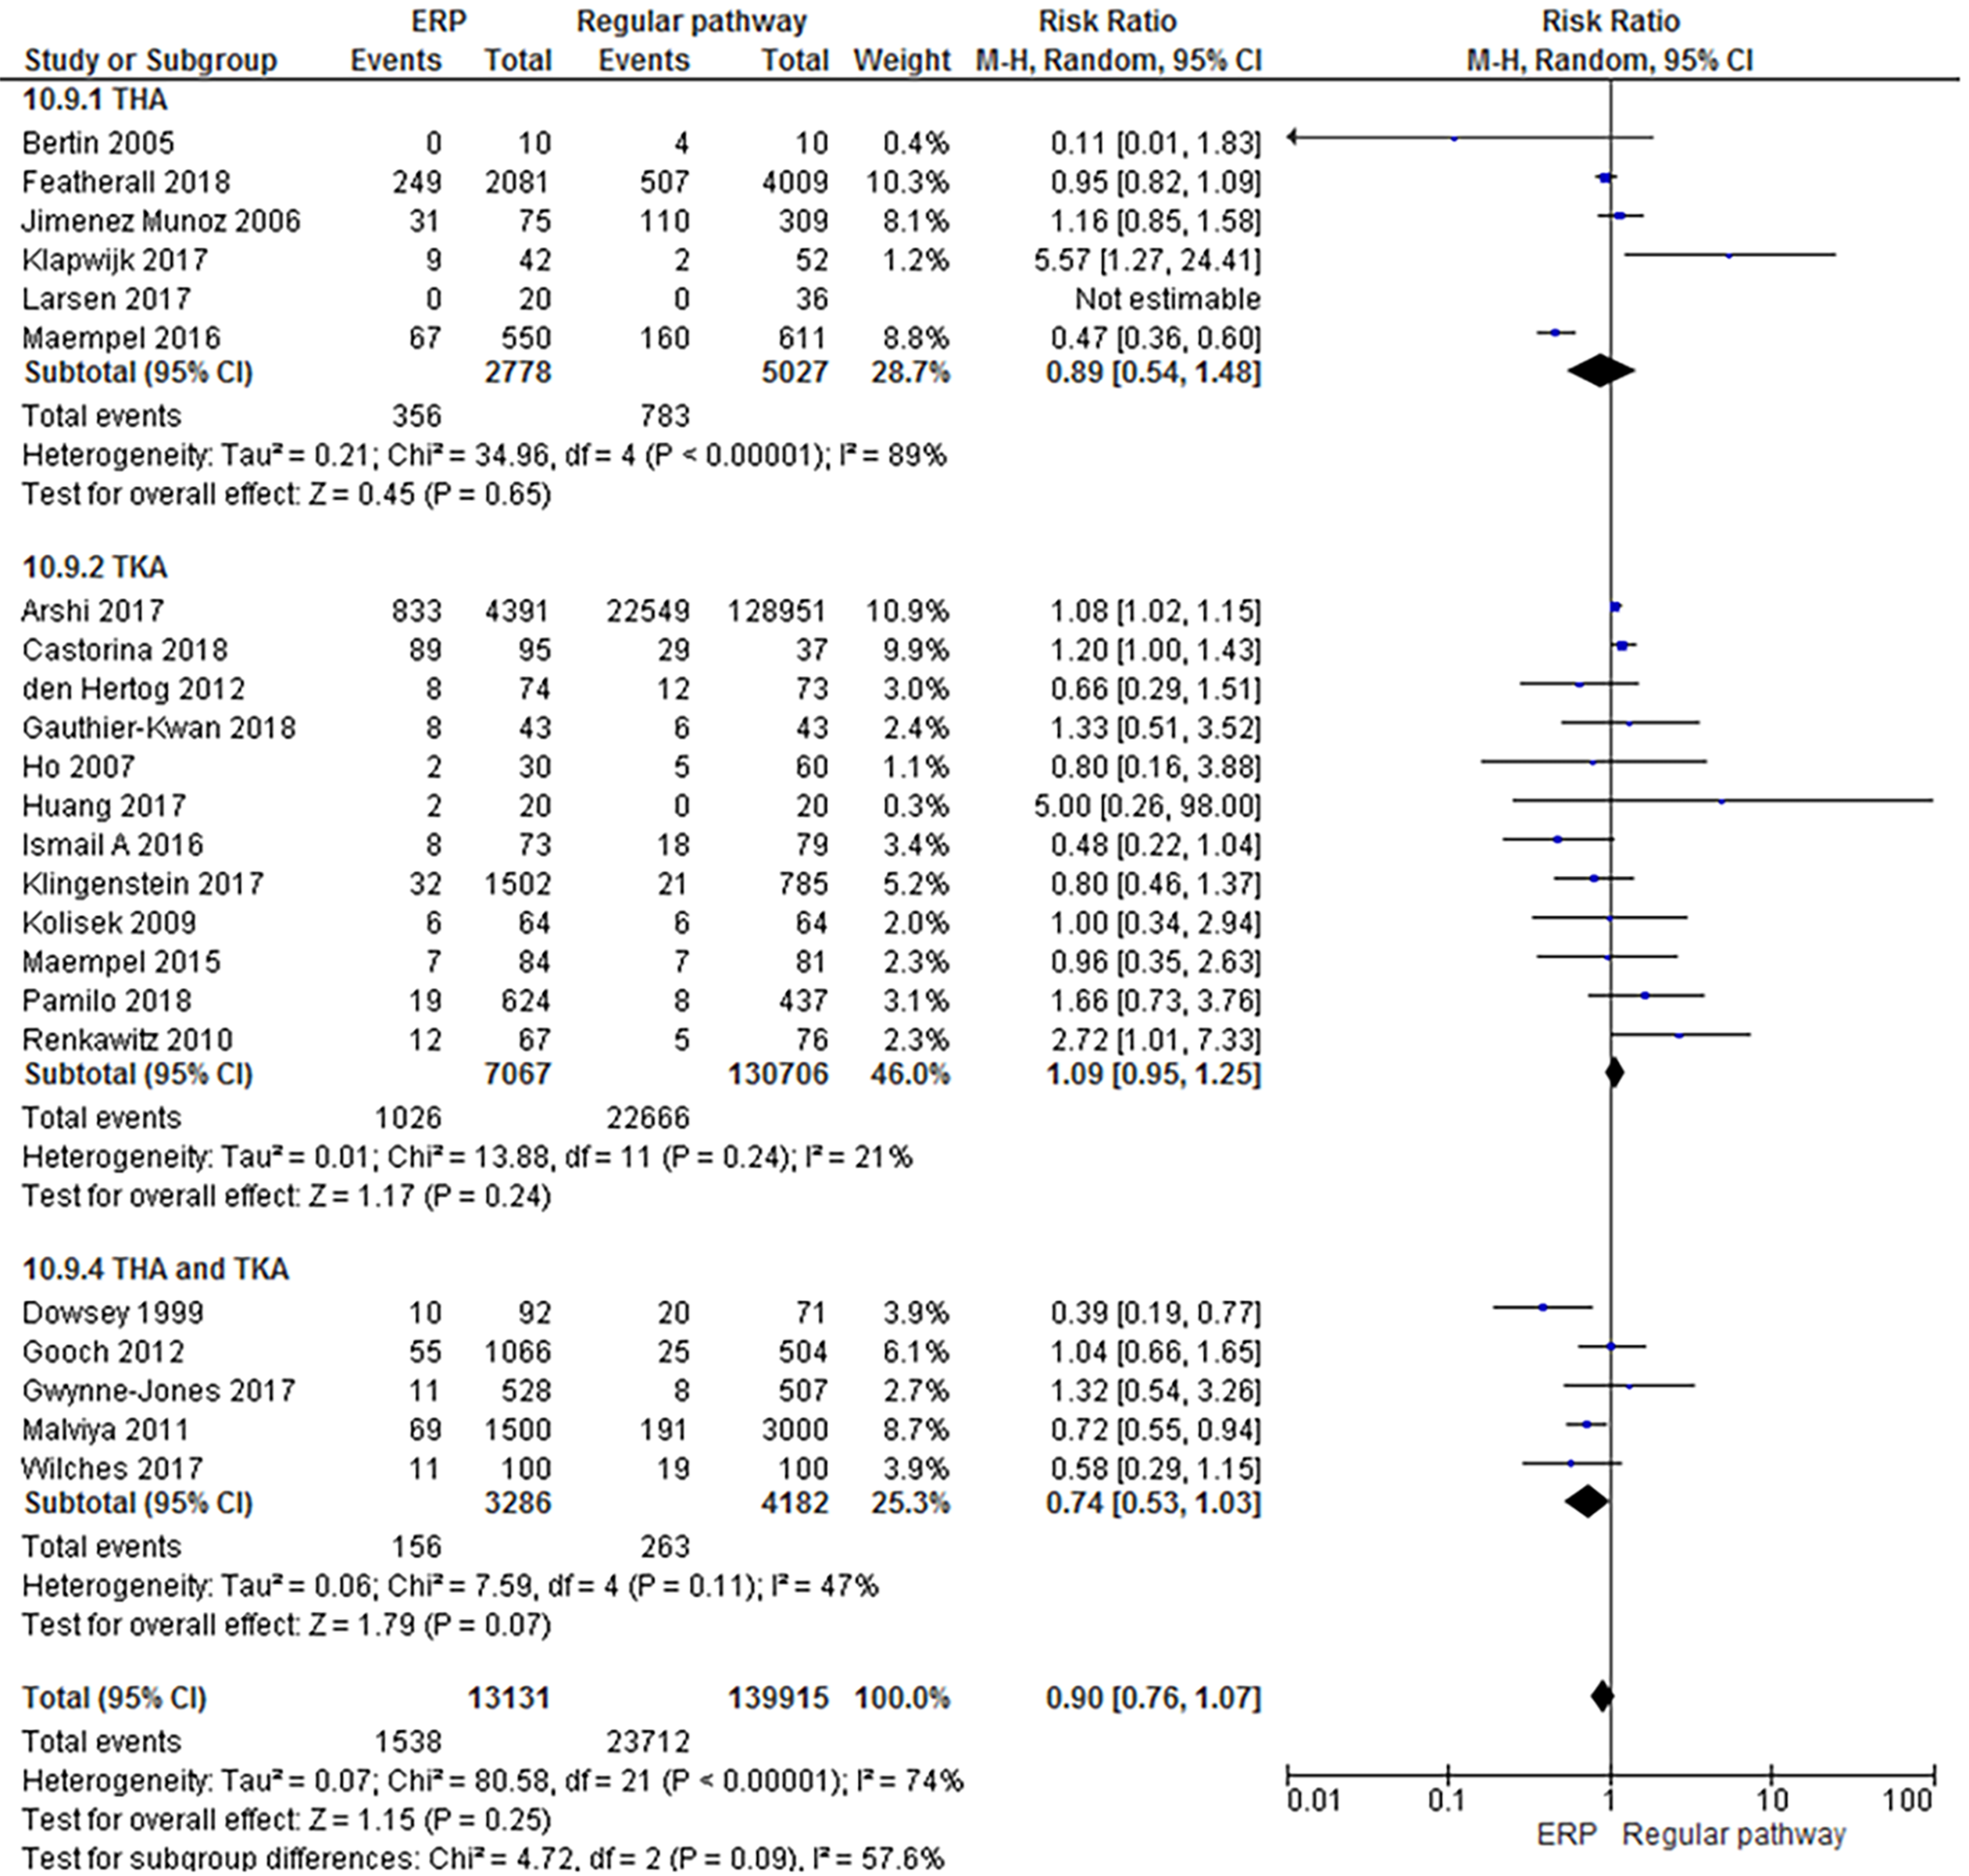
Figure 6 Forest plot with relative risk for each study and pooled relative risk with 95% confidence interval for (serious) adverse events with a follow-up time of 30 d or more for enhanced recovery pathways vs regular pathways for hip and knee arthroplasty.
THA: Total hip arthroplasty; TKA: Total knee arthroplasty; CI: Confidence interval; ERP: Enhanced recovery pathways.
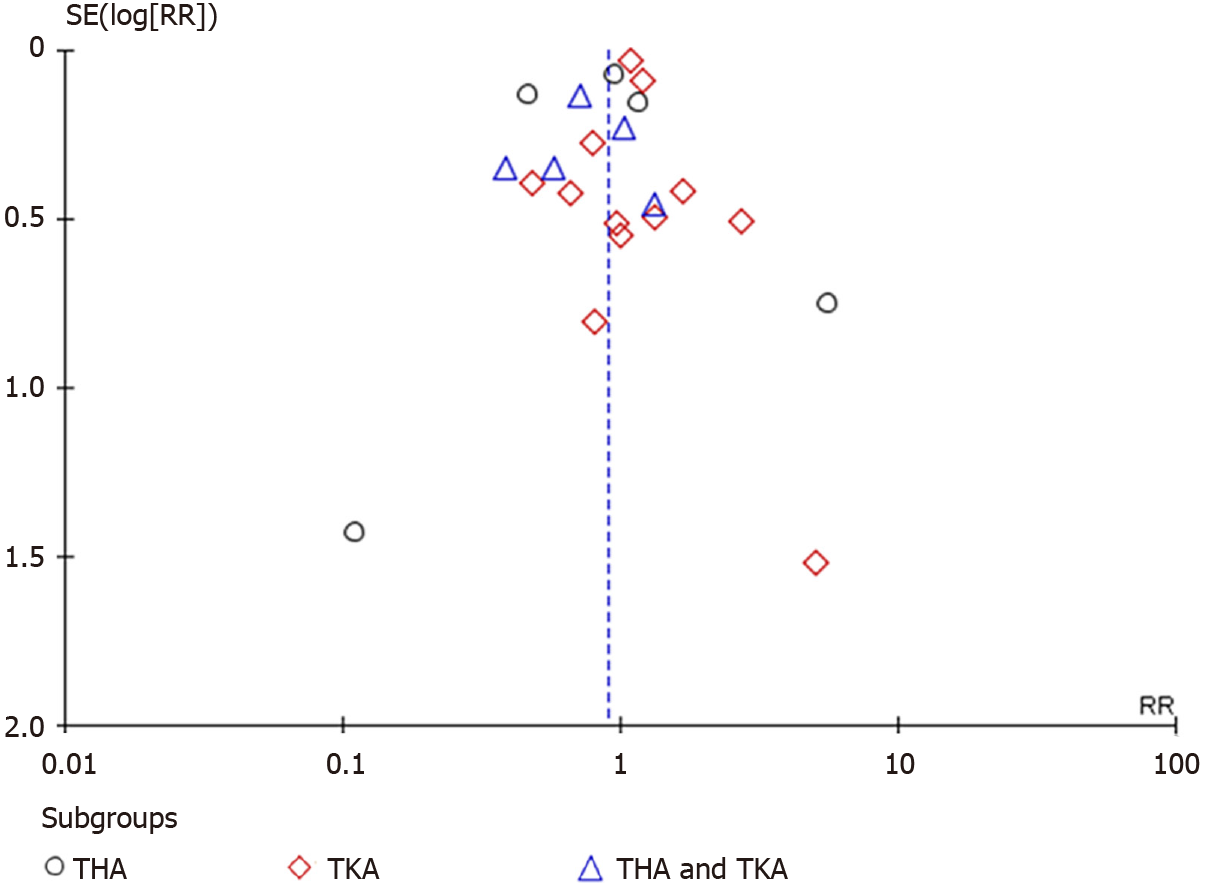
Figure 7 Funnel plot for the studies with described (serious) adverse events with a follow-up time of 30 d or more.
THA: Total hip arthroplasty; TKA: Total knee arthroplasty; RR: Risk ratio.
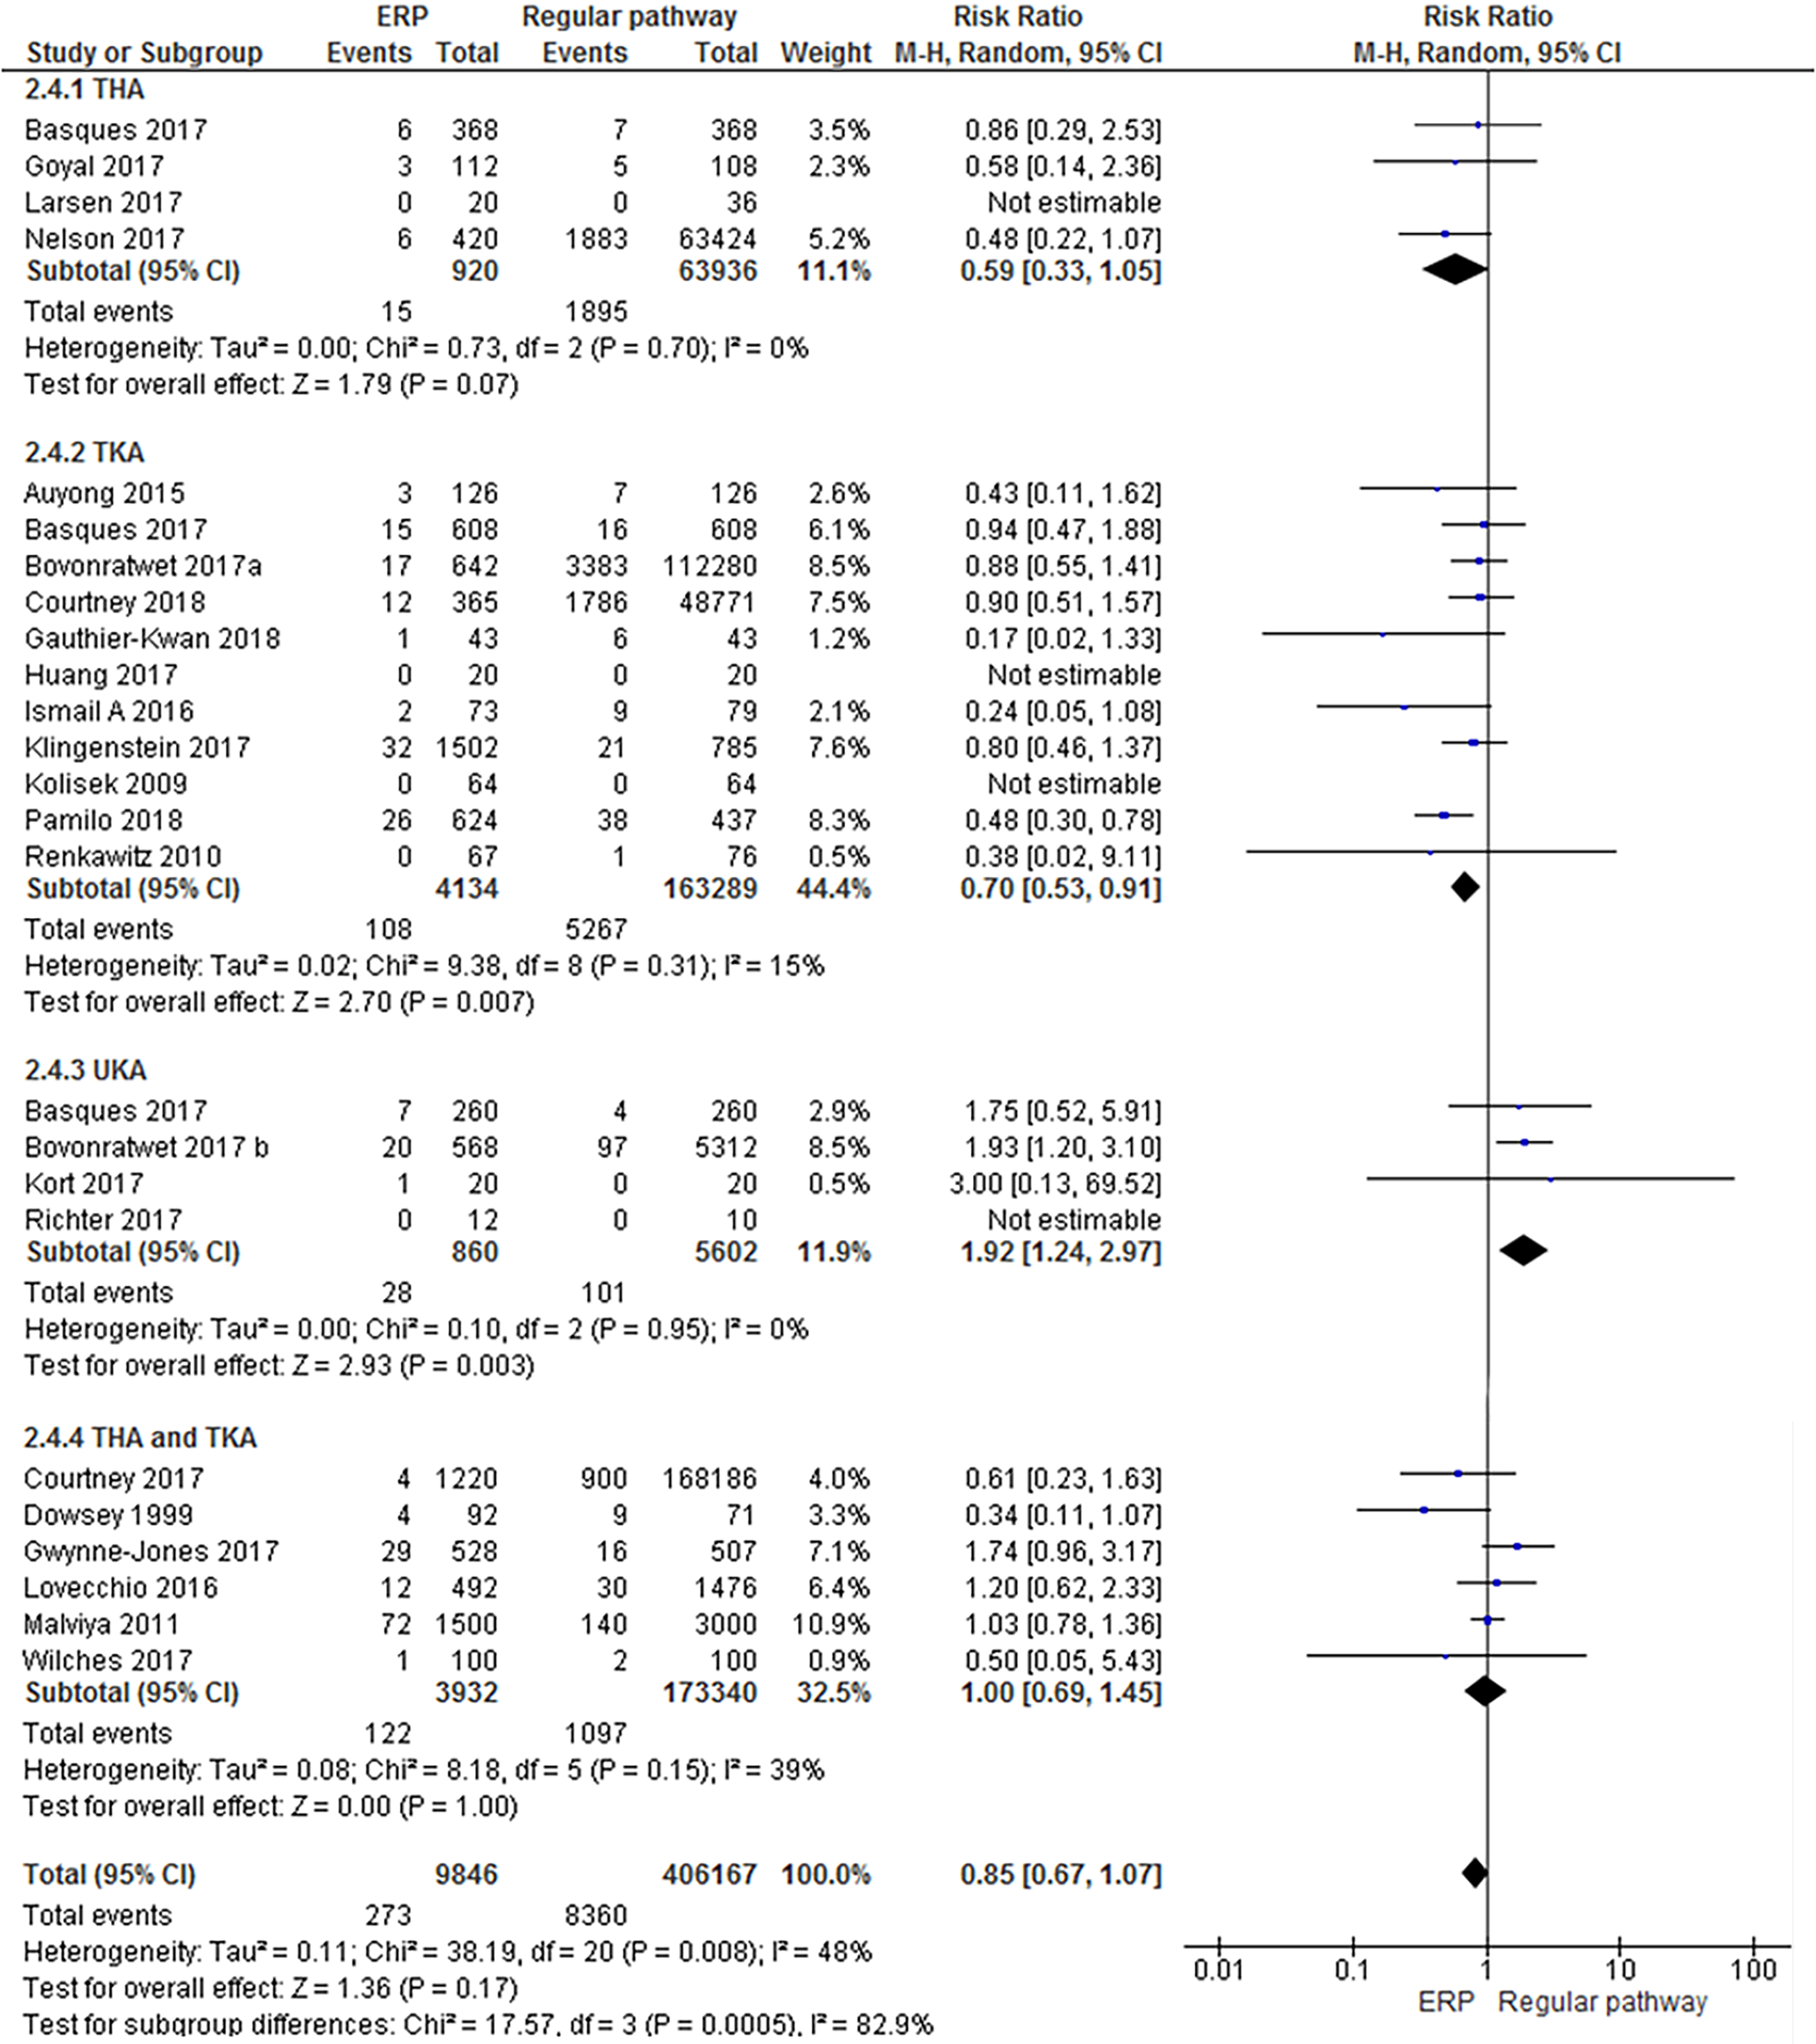
Figure 8 Forest plot with relative risk for each study and pooled relative risk with 95% confidence interval for readmission for enhanced recovery pathways vs regular pathways.
THA: Total hip arthroplasty; TKA: Total knee arthroplasty; CI: Confidence interval; ERP: Enhanced recovery pathways.
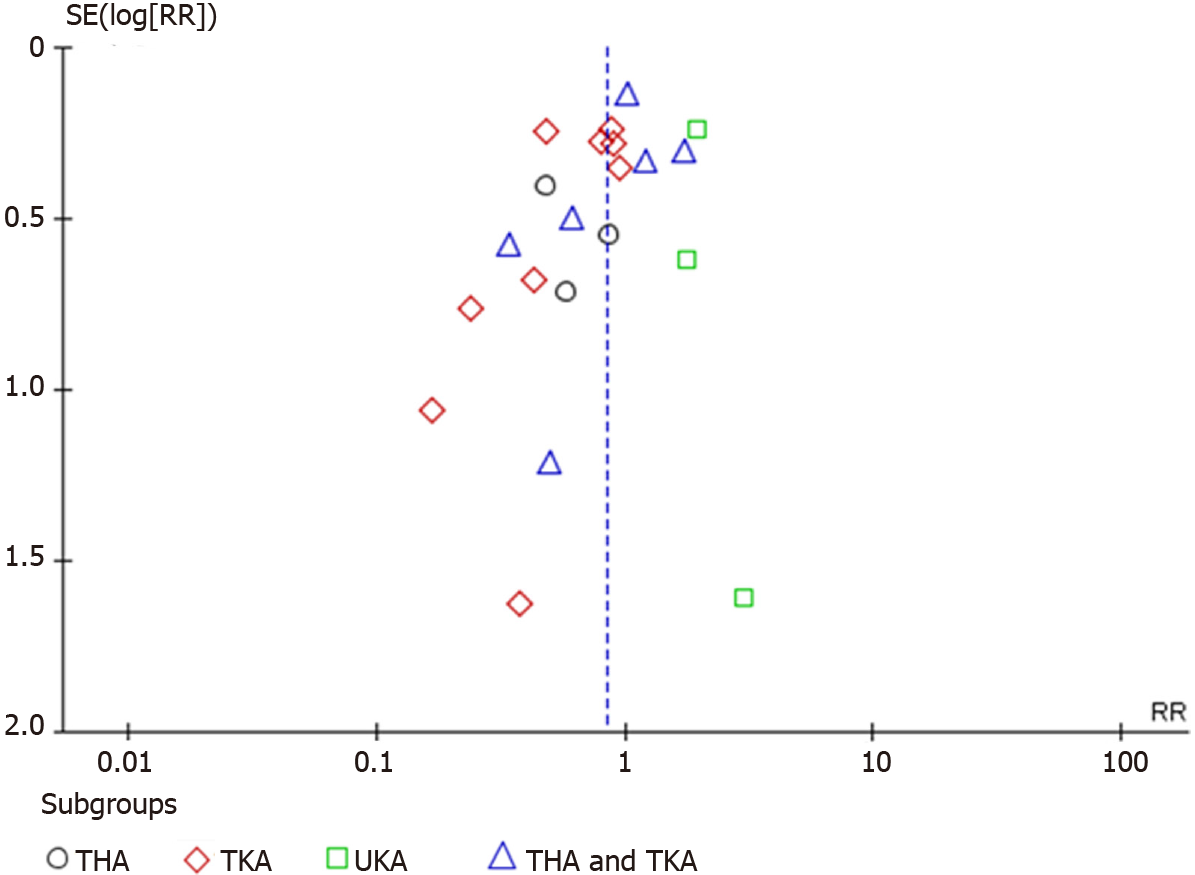
Figure 9 Funnel plot for the studies with described readmission.
THA: Total hip arthroplasty; TKA: Total knee arthroplasty; UKA: Unicompartmental knee arthroplasty; RR: Risk ratio.
- Citation: Heymans MJ, Kort NP, Snoeker BA, Schotanus MG. Impact of enhanced recovery pathways on safety and efficacy of hip and knee arthroplasty: A systematic review and meta-analysis. World J Orthop 2022; 13(3): 307-328
- URL: https://www.wjgnet.com/2218-5836/full/v13/i3/307.htm
- DOI: https://dx.doi.org/10.5312/wjo.v13.i3.307


