Copyright
©The Author(s) 2019.
World J Orthop. Jul 18, 2019; 10(7): 292-298
Published online Jul 18, 2019. doi: 10.5312/wjo.v10.i7.292
Published online Jul 18, 2019. doi: 10.5312/wjo.v10.i7.292
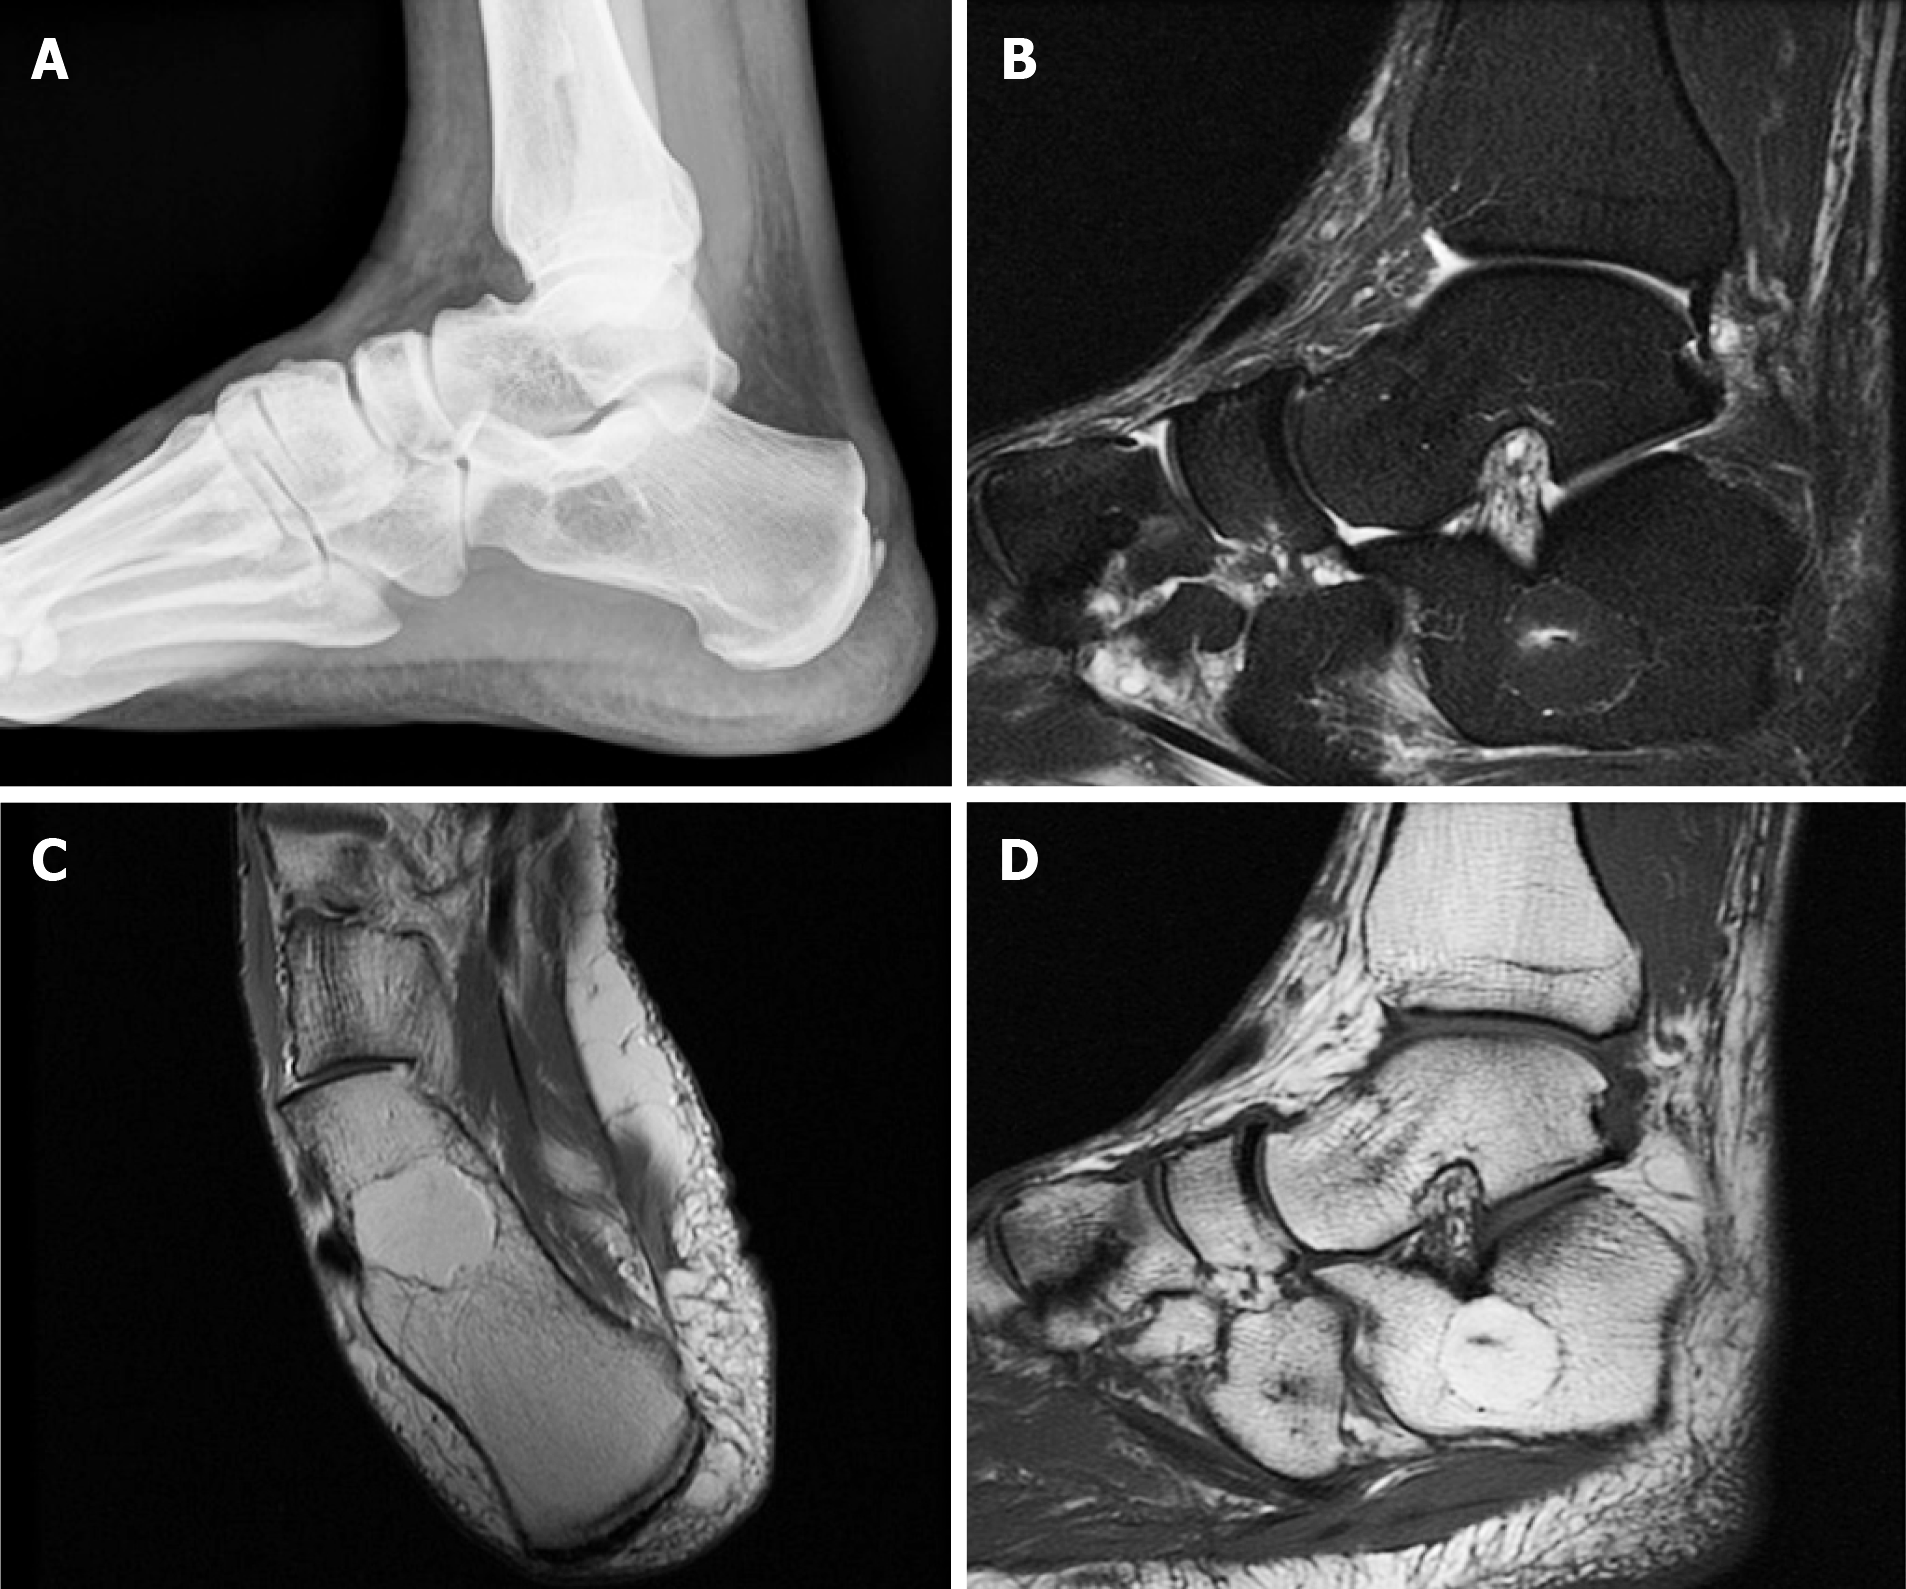
Figure 1 Preoperative imaging of the os calcis lipoma.
A: Initial radiographic presentation. B: T2 STIR sequence magnetic resonance imaging (MRI) image, sagittal view. Fat suppression is presented at the area of the lesion, with high intensity linear signal at the center. No fracture or expansion into the soft tissues was identified. C: T1 sequence MRI, transverse view. D: Sagittal view. Sharply demarcated lesion with homogeneous high intensity signal at Ward’s neutral triangle, with linear low intensity signal at the center. The high signal denotes lipid content of the lesion, whereas the central low intensity signal is compatible with local infarction and necrosis.
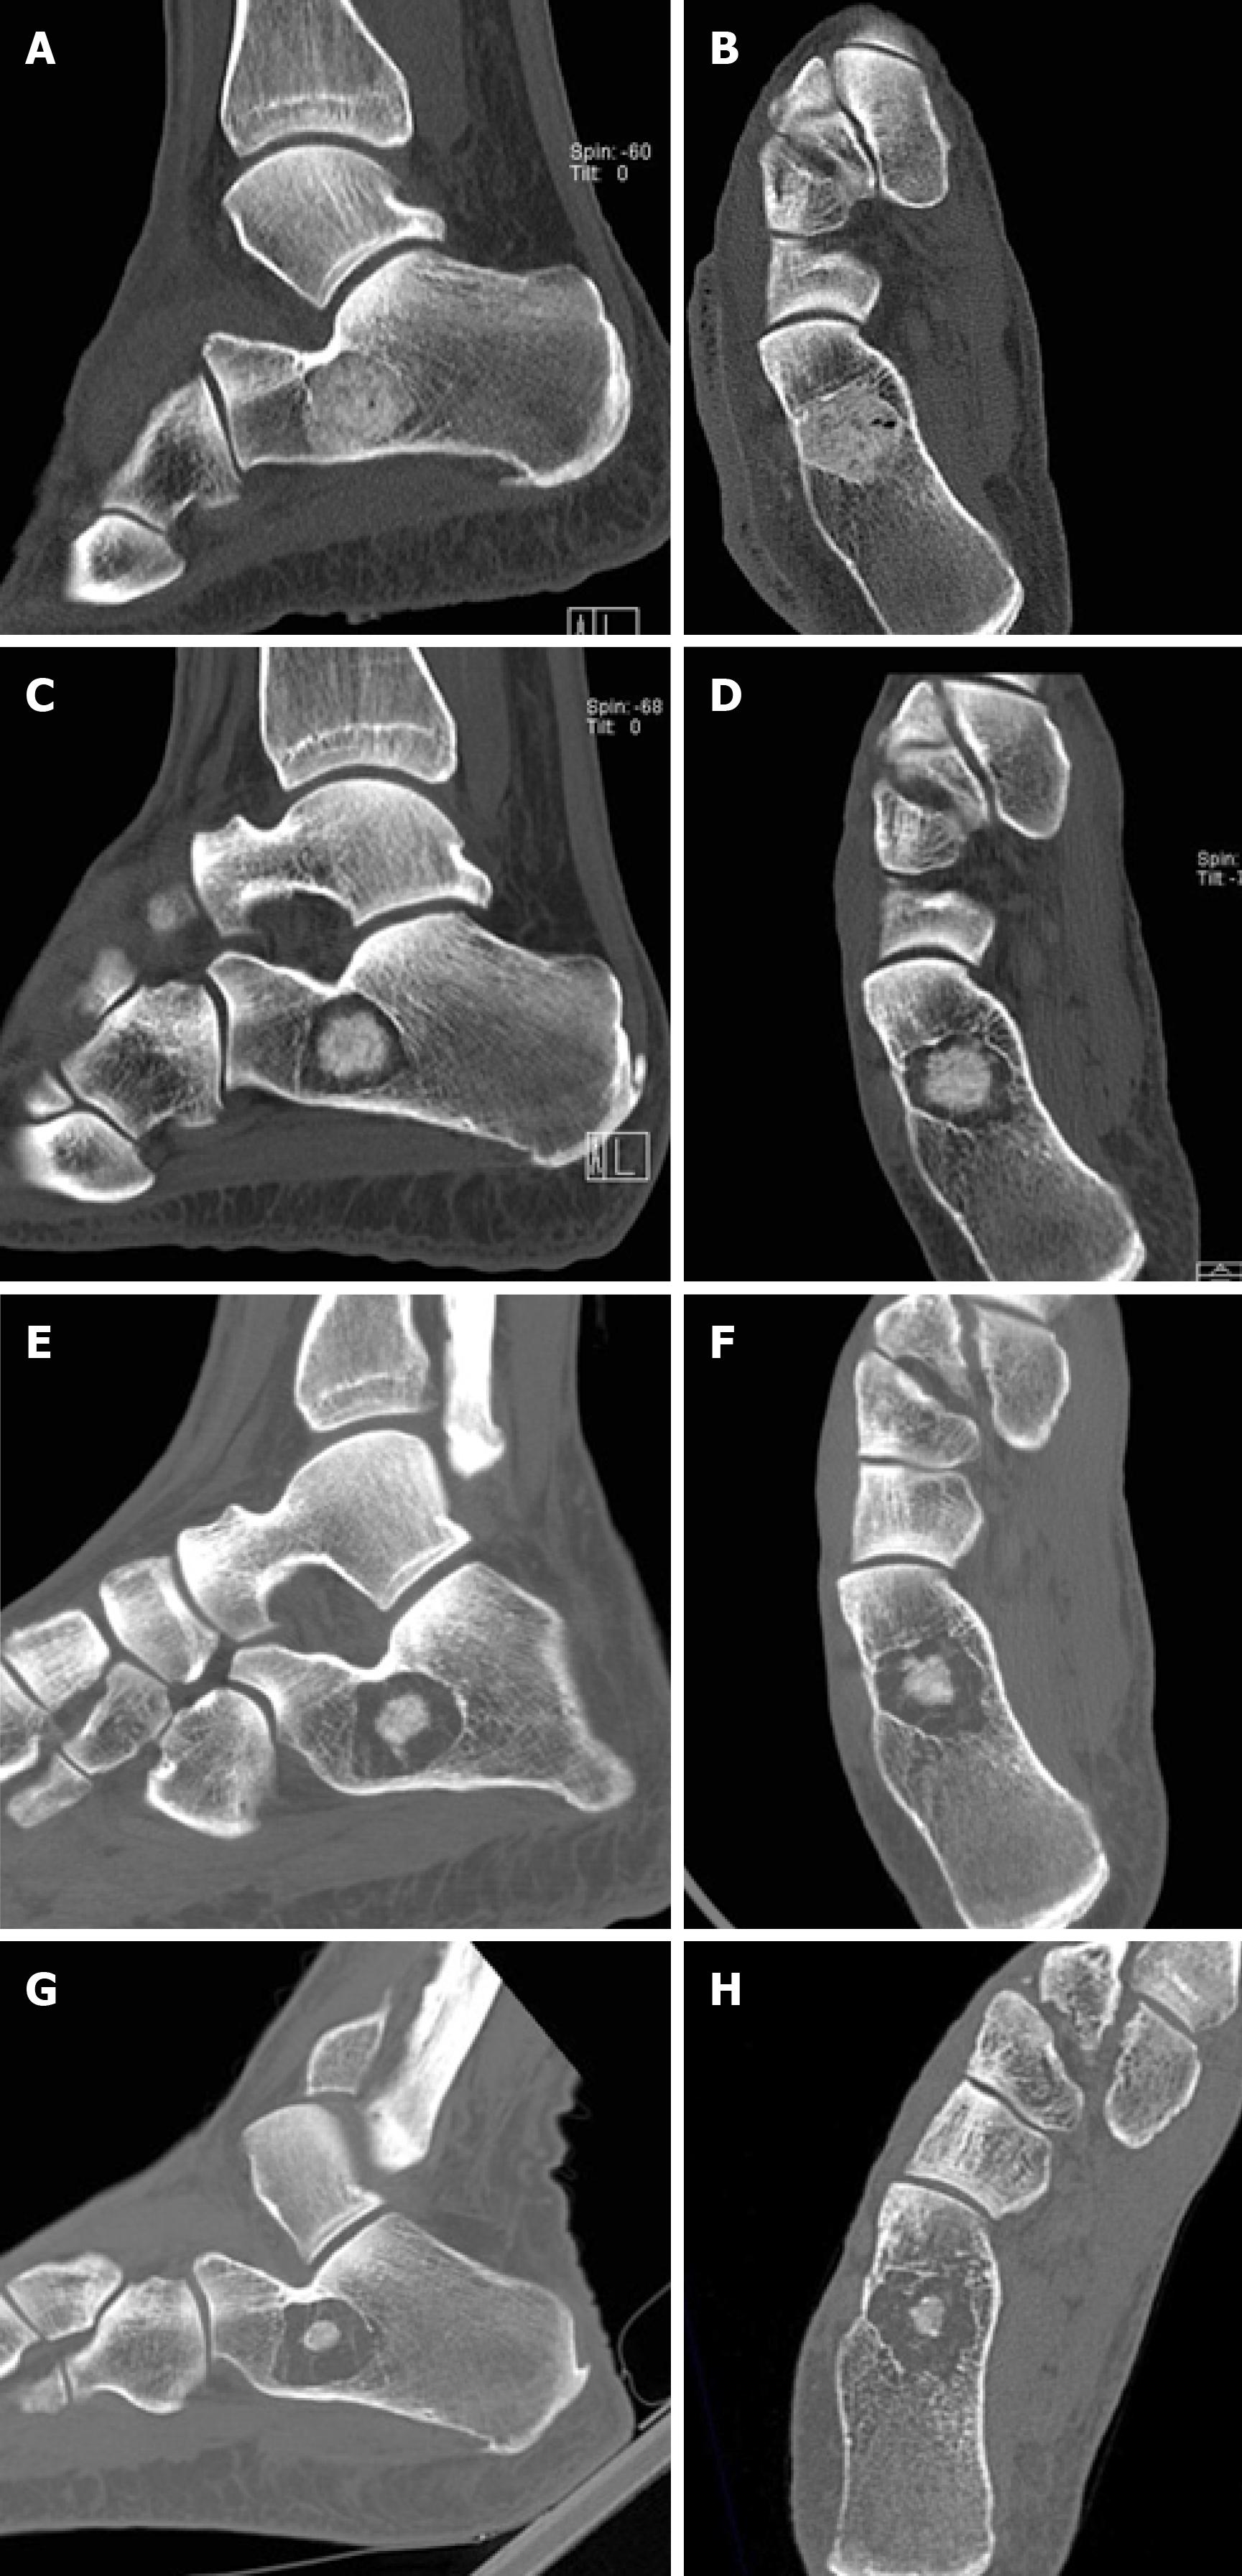
Figure 2 Serial computed tomography evaluation of os calcis lesion.
A and B: Computed tomography images immediately postoperatively. Complete filling of the cavity has been obtained with bone graft. C and D: Six months postoperatively, circumferential graft absorption is present. E and F: Fifteen months postoperatively, further graft absorption is noted. G and H: At five years, the greatest part of the bone graft has been resorbed. A mesh of thin osseous septa is seen around the remaining bone graft. The lesion has not expanded since the first postoperative image.
- Citation: Balbouzis T, Alexopoulos T, Grigoris P. Os calcis lipoma: To graft or not to graft? - A case report and literature review. World J Orthop 2019; 10(7): 292-298
- URL: https://www.wjgnet.com/2218-5836/full/v10/i7/292.htm
- DOI: https://dx.doi.org/10.5312/wjo.v10.i7.292


