Copyright
©2011 Baishideng Publishing Group Co.
World J Clin Oncol. Jul 10, 2011; 2(7): 289-298
Published online Jul 10, 2011. doi: 10.5306/wjco.v2.i7.289
Published online Jul 10, 2011. doi: 10.5306/wjco.v2.i7.289
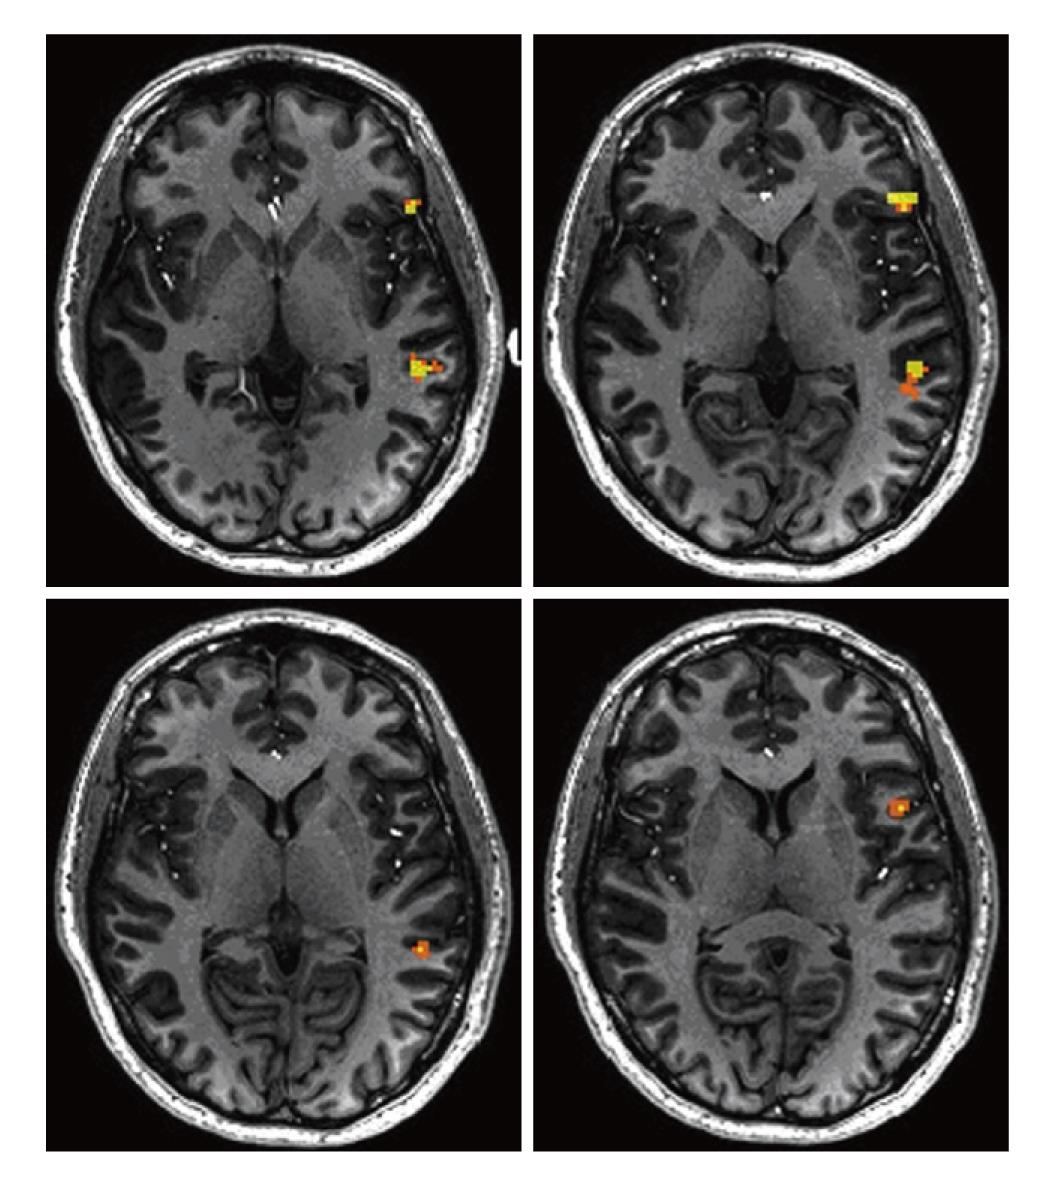
Figure 2 Activation (colored voxels) in the Broca’s and Wernicke’s areas in a normal subject performing a phonemic fluency task.
The t-score map was thresholded at 4.0 value (P < 0.001) and superimposed on a high resolution T1 weighted MPRAGE image. AFNI software (afni.nimh.nih.gov) was used for data processing.
- Citation: Zaca D, Hua J, Pillai JJ. Cerebrovascular reactivity mapping for brain tumor presurgical planning. World J Clin Oncol 2011; 2(7): 289-298
- URL: https://www.wjgnet.com/2218-4333/full/v2/i7/289.htm
- DOI: https://dx.doi.org/10.5306/wjco.v2.i7.289


