Copyright
©2011 Baishideng Publishing Group Co.
World J Clin Oncol. Jul 10, 2011; 2(7): 289-298
Published online Jul 10, 2011. doi: 10.5306/wjco.v2.i7.289
Published online Jul 10, 2011. doi: 10.5306/wjco.v2.i7.289
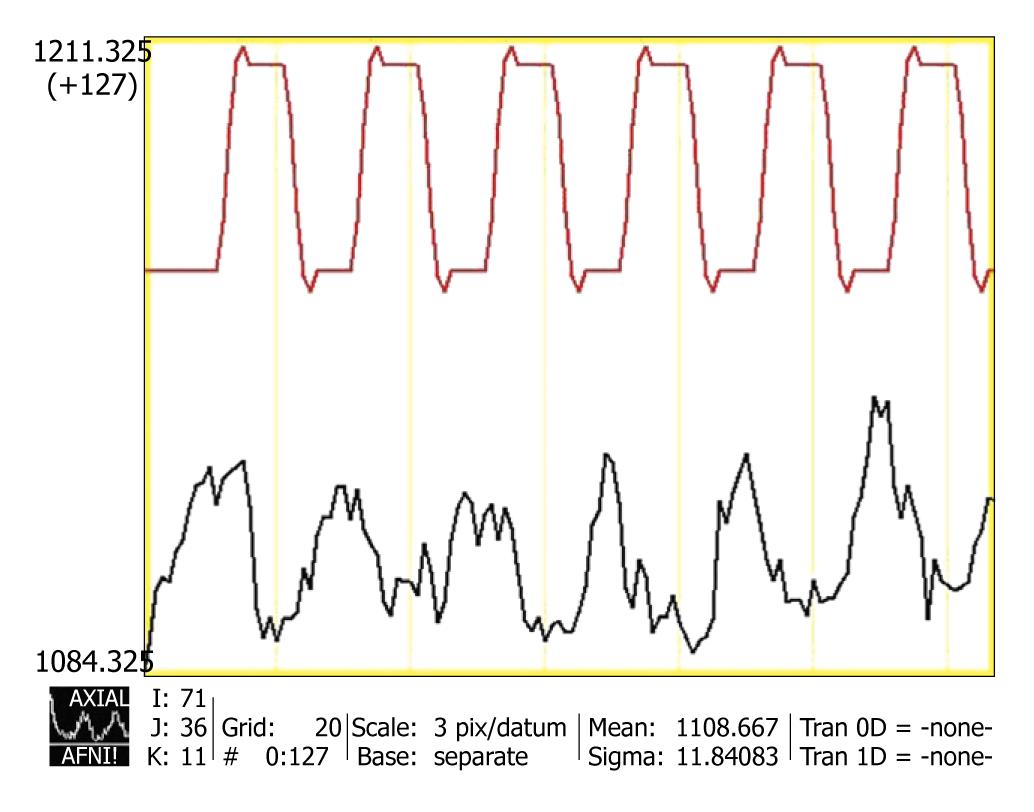
Figure 1 Magnetic resonance signal time series (black line) in an activated voxel.
Subject was engaged in a language phonemic task over a time period of 260 s. The red line curve represents the ideal hemodynamic response function the voxel time series was fitted to. Very good correlation between the two curves can be easily seen. AFNI software (afni.nimh.nih.gov) was used for data processing.
- Citation: Zaca D, Hua J, Pillai JJ. Cerebrovascular reactivity mapping for brain tumor presurgical planning. World J Clin Oncol 2011; 2(7): 289-298
- URL: https://www.wjgnet.com/2218-4333/full/v2/i7/289.htm
- DOI: https://dx.doi.org/10.5306/wjco.v2.i7.289


