Copyright
©The Author(s) 2016.
World J Gastrointest Pharmacol Ther. May 6, 2016; 7(2): 242-253
Published online May 6, 2016. doi: 10.4292/wjgpt.v7.i2.242
Published online May 6, 2016. doi: 10.4292/wjgpt.v7.i2.242
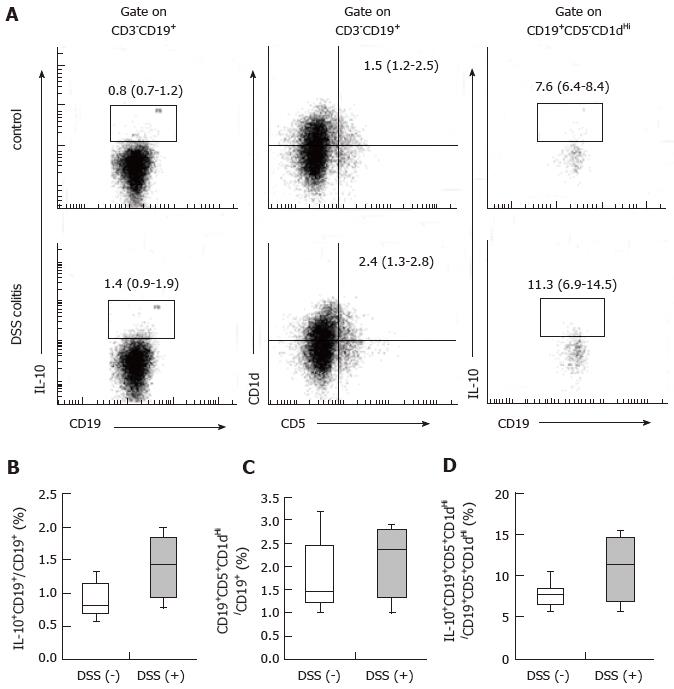
Figure 4 Regulatory B cell frequency in the spleen as determined by flow cytometry.
A: Analysis of CD19+IL-10+ cell populations (left panel), CD19+CD5+CD1dHi cell populations (center panel) and CD19+CD5+CD1dHiIL-10+ cell populations (right panel) in the spleen based on flow cytometry. Representative data are shown for control mice (top panel) and DSS colitis mice (bottom panel); B: CD19+IL-10+ cell frequencies among CD19+ cells in the spleens of DSS colitis mice and control mice. CD19+IL-10+ cell frequency among CD19+ cells was comparable in the spleens of DSS mice (closed bar) and control mice (open bar); C: CD19+CD5+CD1dHi cell frequencies among CD19+ cells in the spleens of DSS colitis mice and control mice. CD19+CD5+CD1dHi cell frequency among CD19+ cells was comparable in the spleens of DSS mice (closed bar) and control mice (open bar); D: IL-10+ cell frequencies among CD19+CD5+CD1dHi cell populations in the spleens of DSS colitis mice and control mice. IL-10+ cell frequency among the CD19+CD5+CD1dHi cell population tended to increase in the spleens of the DSS mice (closed bar) compared with those of the control mice (open bar). All results represent at least two independent experiments with four to six mice in each group. The data are shown as the median and interquartile range. DSS: Dextran sulfate sodium; IL: Interleukin.
- Citation: Ino S, Kohda C, Takeshima K, Ishikawa H, Norose T, Yamochi T, Takimoto M, Takahashi H, Tanaka K. Oral tolerance is inducible during active dextran sulfate sodium-induced colitis. World J Gastrointest Pharmacol Ther 2016; 7(2): 242-253
- URL: https://www.wjgnet.com/2150-5349/full/v7/i2/242.htm
- DOI: https://dx.doi.org/10.4292/wjgpt.v7.i2.242


