
















©The Author(s) 2025.
World J Gastrointest Pharmacol Ther. Dec 5, 2025; 16(4): 111977
Published online Dec 5, 2025. doi: 10.4292/wjgpt.v16.i4.111977
Published online Dec 5, 2025. doi: 10.4292/wjgpt.v16.i4.111977
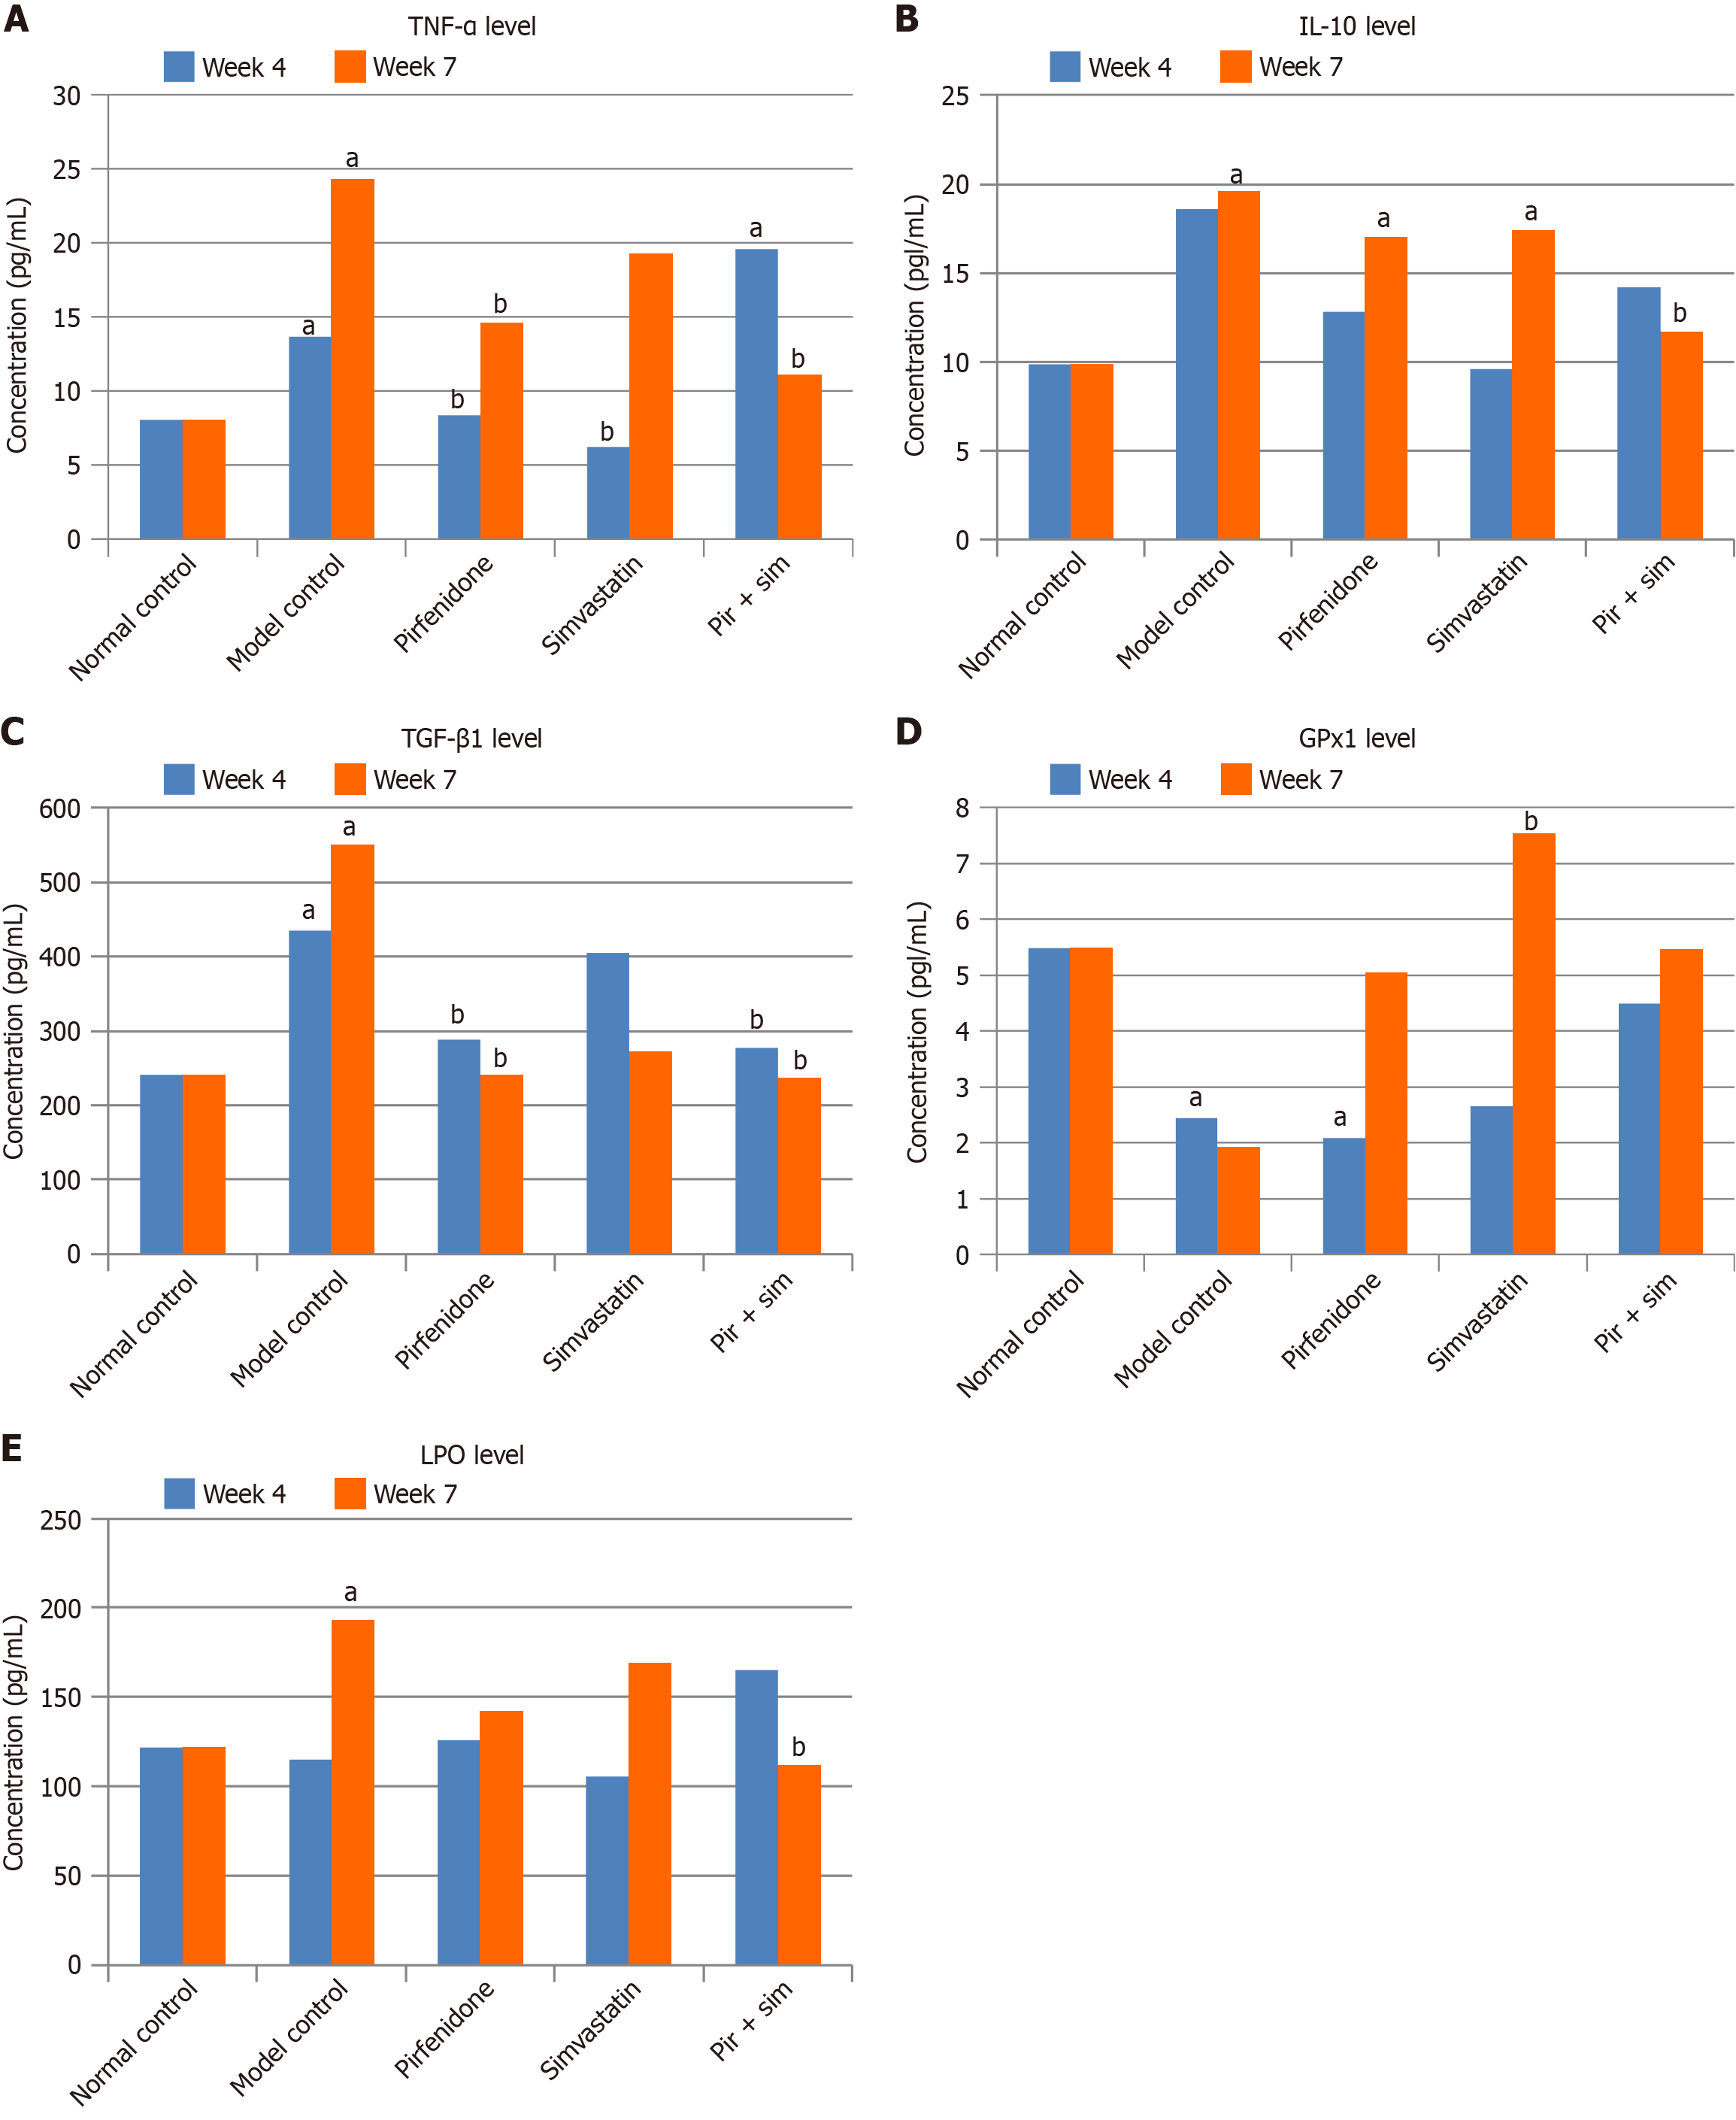
Figure 3 Indicators after 4 weeks and 7 weeks of treatment in mice.
A: Tumor necrosis factor-alpha level; B: Interleukin-10 level; C: Transforming growth factor-beta 1 level; D: Glutathione peroxidase1 level; E: Lipid peroxidation level. All values are expressed as mean ± SD error of the mean. aP < 0.05 vs normal control group; bP < 0.05 vs model control group. One-way analysis of variance followed by Tukey’s test. n = 7. Pir: Pirfenidone; Sim: Simvastatin; TNF-α: Tumor necrosis factor-alpha; IL-10: Interleukin-10; TGF-β1: Transforming growth; GPx1: Glutathione peroxidase 1; LPO: Lipid peroxidation.
- Citation: Mehta R, Patel A, Vyas B, Desai B, Adhvaryu D, Sojitra P, Bhuptani S. L-arginine-induced chronic pancreatitis in mice: Evaluating effects of pirfenidone and simvastatin. World J Gastrointest Pharmacol Ther 2025; 16(4): 111977
- URL: https://www.wjgnet.com/2150-5349/full/v16/i4/111977.htm
- DOI: https://dx.doi.org/10.4292/wjgpt.v16.i4.111977