
















©The Author(s) 2025.
World J Gastrointest Pharmacol Ther. Dec 5, 2025; 16(4): 110273
Published online Dec 5, 2025. doi: 10.4292/wjgpt.v16.i4.110273
Published online Dec 5, 2025. doi: 10.4292/wjgpt.v16.i4.110273
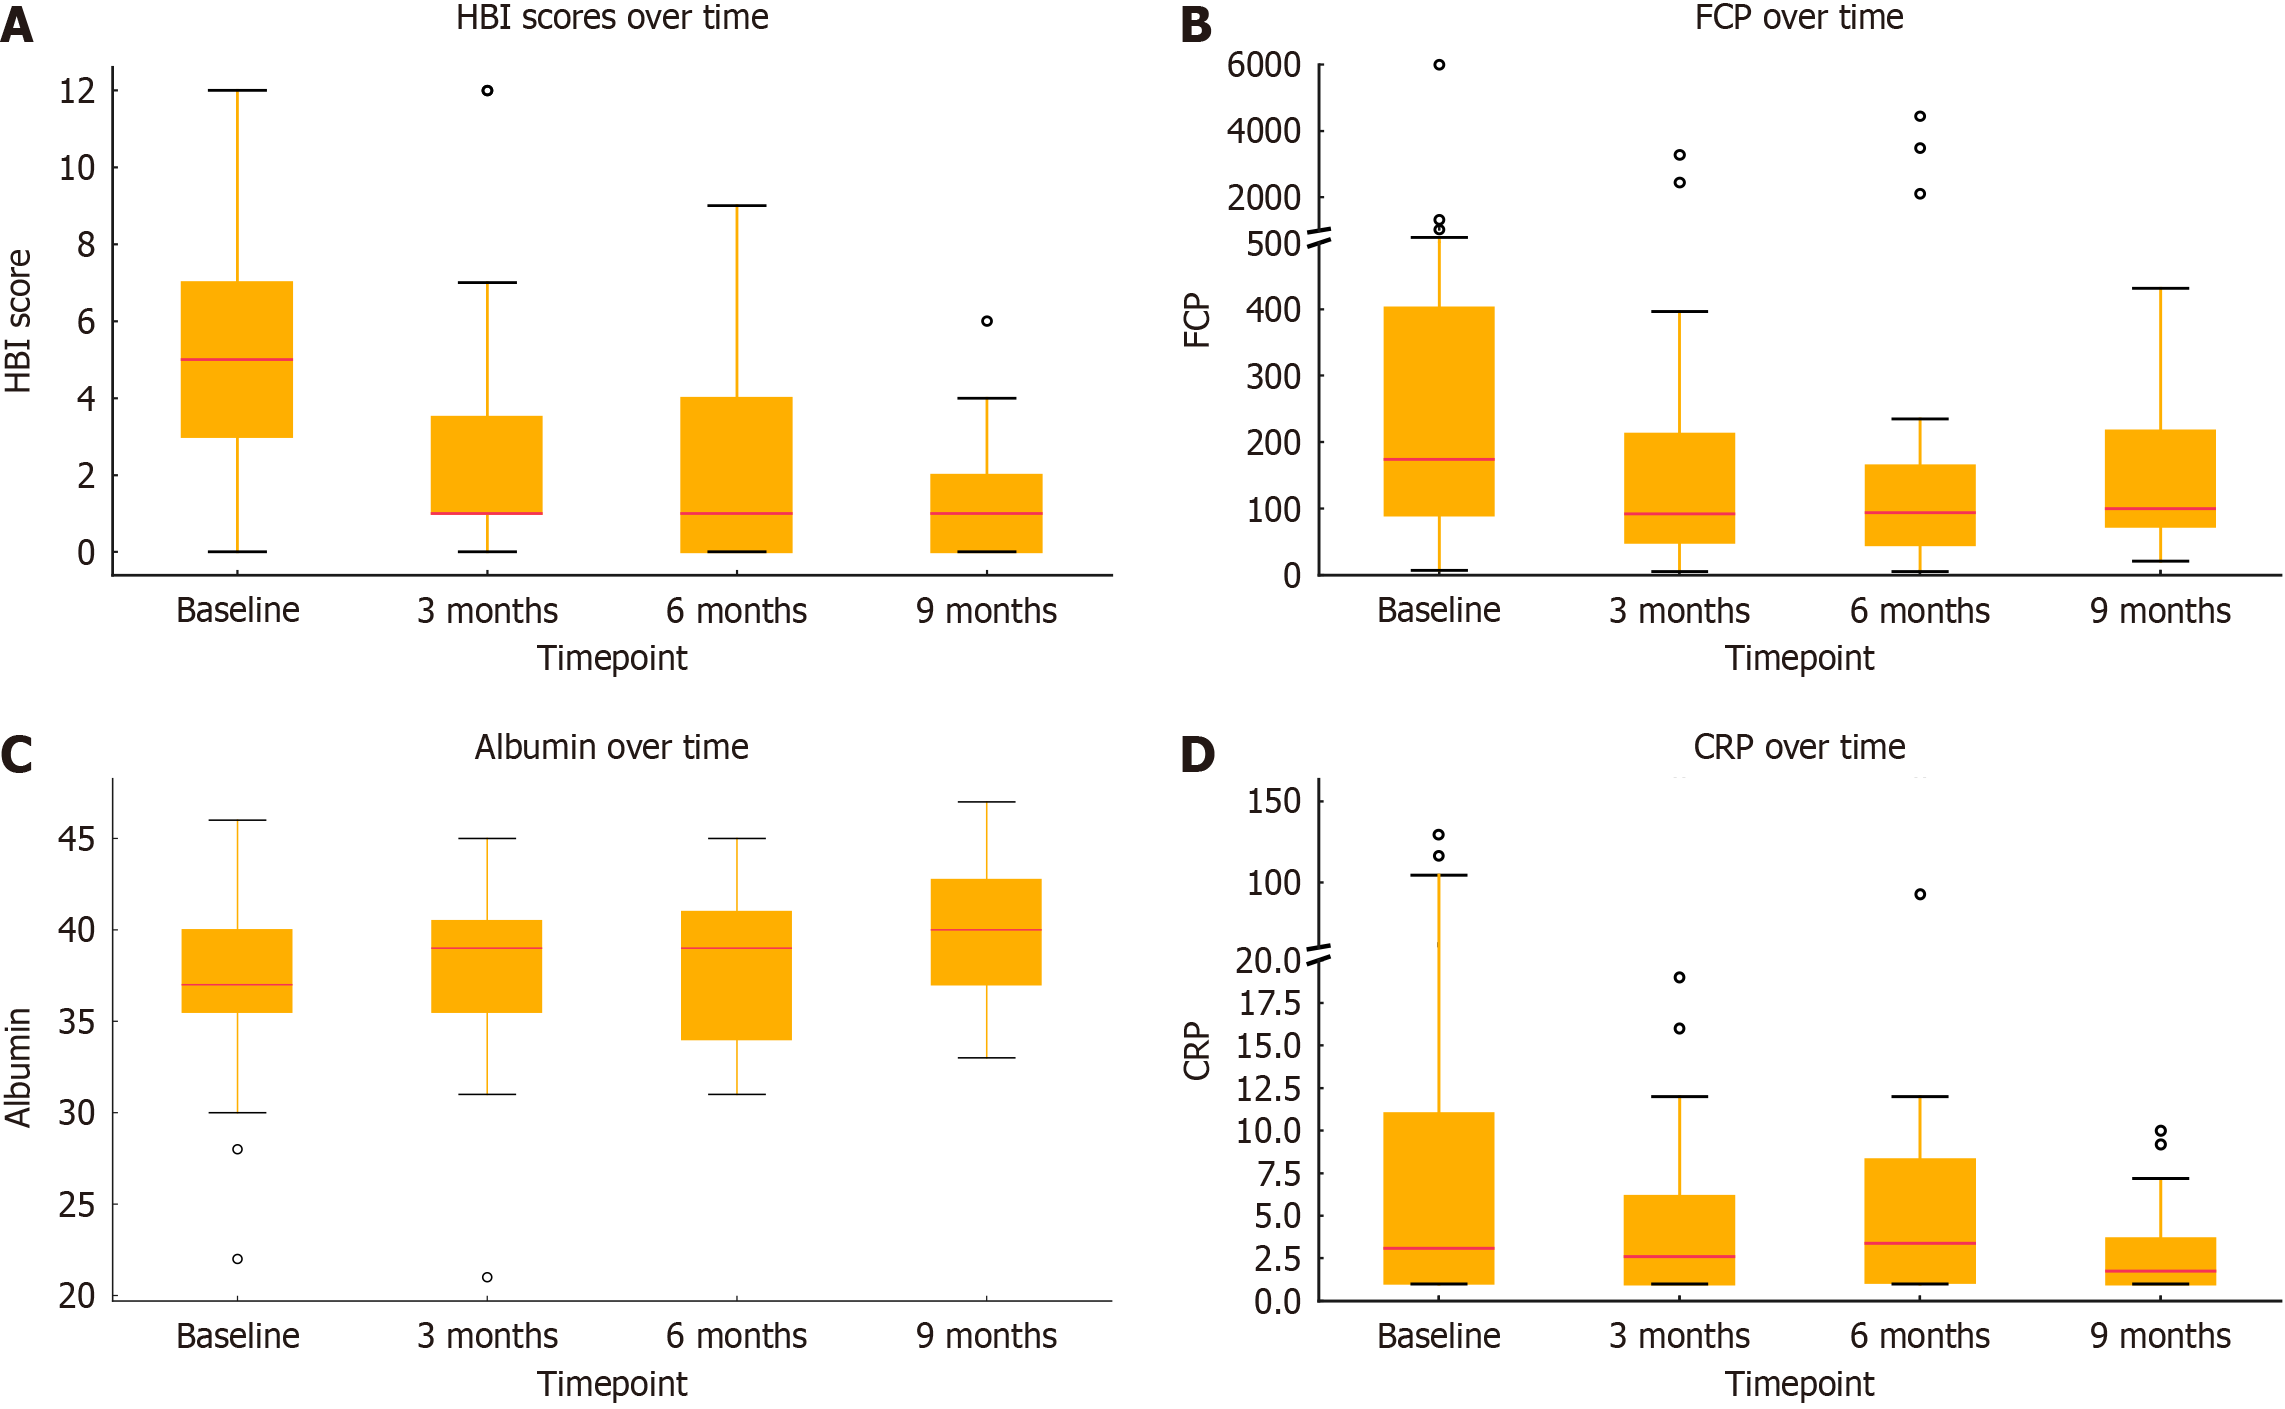
Figure 2 Box and whisker plots of the data points over time.
The boxes represent interquartile ranges from 25th to 75th. The horizontal lines within each box represent the median value. The whiskers extend to the smallest and largest values within 1.5 × the interquartile range from the lower and upper quartiles. Dots represent outliers. A: Harvey bradshaw index over time; B: Mean faecal calprotectin (μg/g) over time; C: Mean serum albumin (g/L) over time; D: Mean C-reactive protein (mg/L) over time. HBI: Harvey-Bradshaw Index; FCP: Faecal calprotectin; CRP: C-reactive protein.
- Citation: Colwill M, Padley J, Qazi U, Mehta S, Donovan F, Alves AM, Pollok R, Patel K, Dawson P, Honap S, Poullis A. Risankizumab is effective following ustekinumab failure in Crohn’s disease: A real-world study from a tertiary center. World J Gastrointest Pharmacol Ther 2025; 16(4): 110273
- URL: https://www.wjgnet.com/2150-5349/full/v16/i4/110273.htm
- DOI: https://dx.doi.org/10.4292/wjgpt.v16.i4.110273