Copyright
©2010 Baishideng.
World J Gastrointest Pharmacol Ther. Feb 6, 2010; 1(1): 3-8
Published online Feb 6, 2010. doi: 10.4292/wjgpt.v1.i1.3
Published online Feb 6, 2010. doi: 10.4292/wjgpt.v1.i1.3
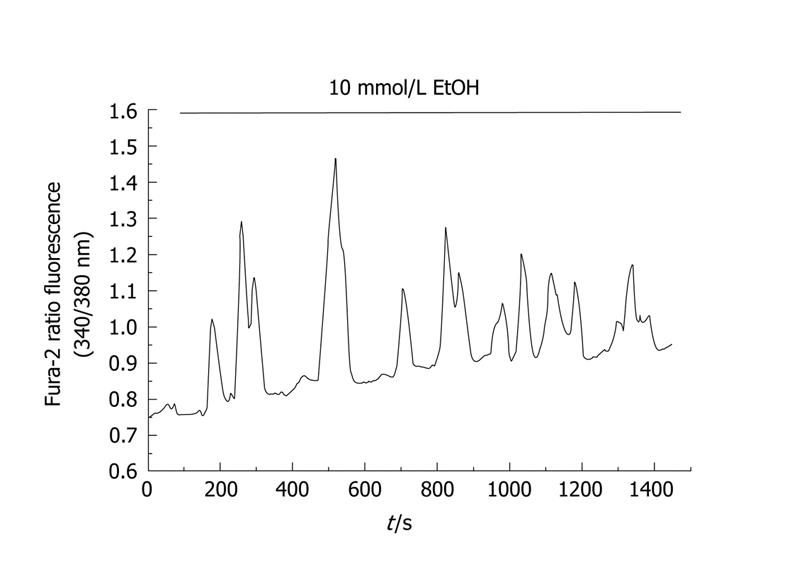
Figure 1 Time-course of changes in [Ca2+]i in response to ethanol.
Cells were loaded with the fluorescent probe fura-2. Changes in fluorescence emitted by the fluorophore reflect changes in [Ca2+]i. In this setup, pancreatic acinar cells were stimulated with 10 mmol/L ethanol, which induced an oscillatory pattern in [Ca2+]i. The horizontal bar indicates the time during which ethanol was applied to the cells. (nm, nanometers).
- Citation: Tapia JA, Salido GM, González A. Ethanol consumption as inductor of pancreatitis. World J Gastrointest Pharmacol Ther 2010; 1(1): 3-8
- URL: https://www.wjgnet.com/2150-5349/full/v1/i1/3.htm
- DOI: https://dx.doi.org/10.4292/wjgpt.v1.i1.3


