
















©The Author(s) 2018.
World J Gastrointest Pathophysiol. Sep 29, 2018; 9(2): 47-58
Published online Sep 29, 2018. doi: 10.4291/wjgp.v9.i2.47
Published online Sep 29, 2018. doi: 10.4291/wjgp.v9.i2.47
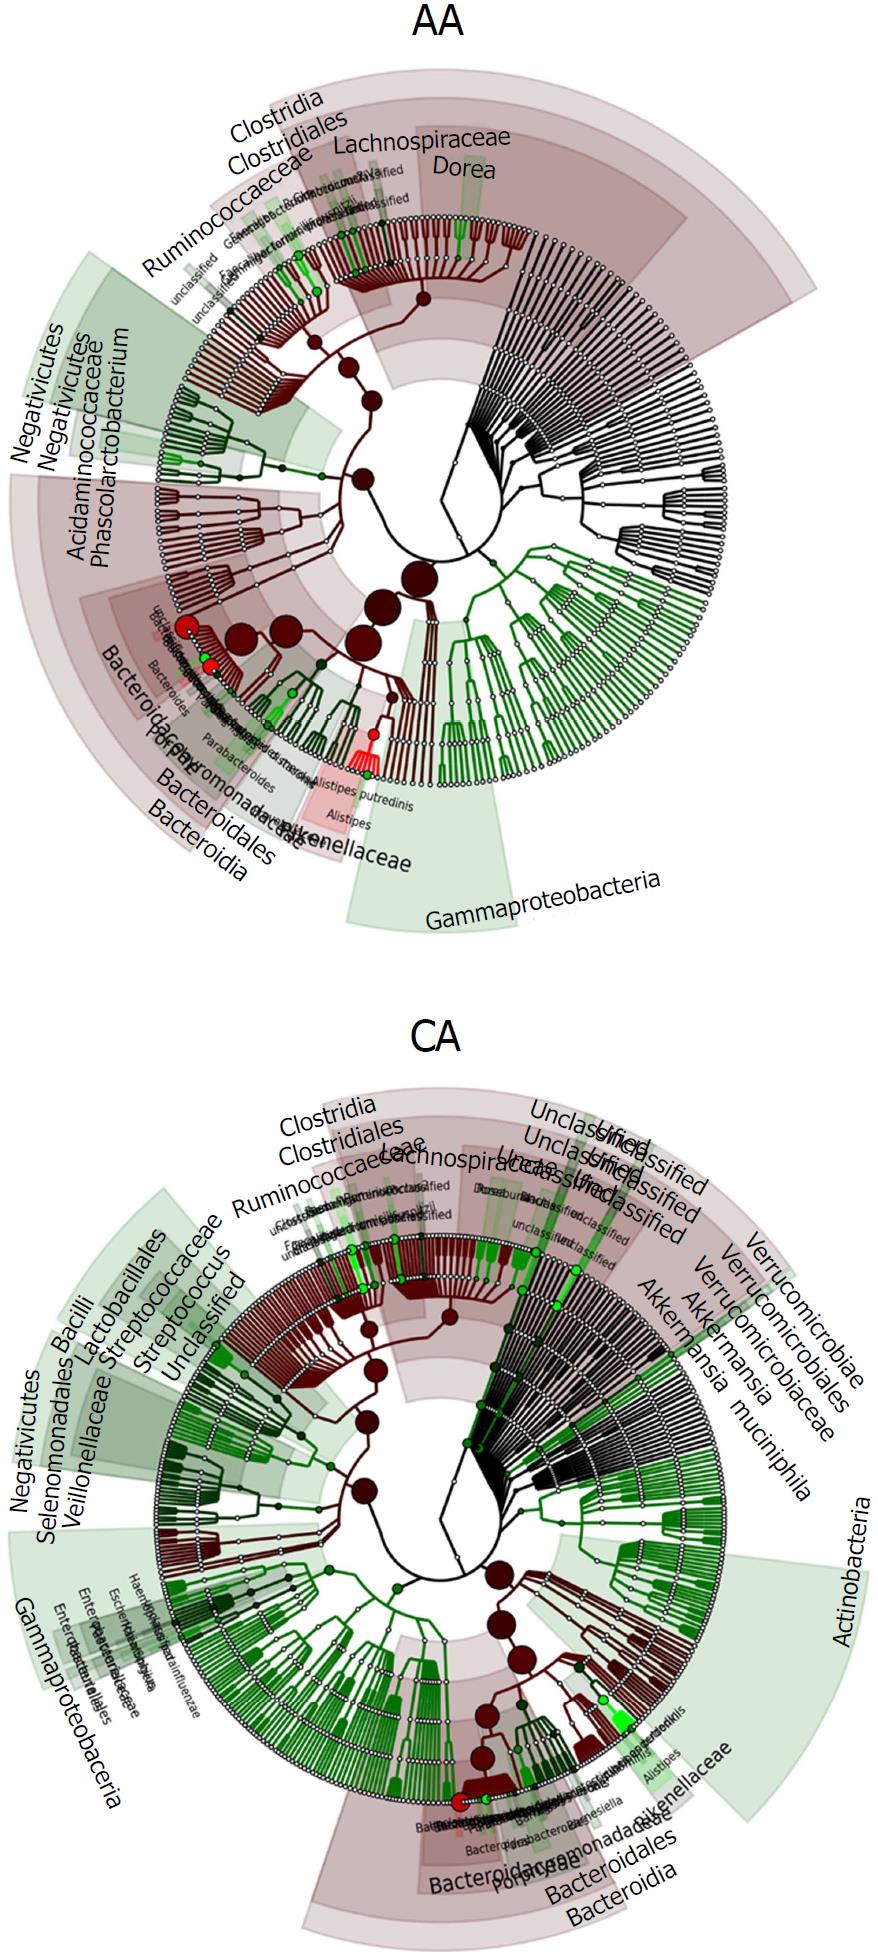
Figure 6 Phylogenetic tree showing the differences and abundance of taxa in African Americans and Caucasian Americans colonic effluents.
The taxon size and color indicate the relative abundance of family. GraPhlAn software was used for taxonomic classification and circular taxonomic phylogenetic trees and Ribosomal Database Project classifier, Quantitative Insights into Microbial Ecology, R software/Tool were used for taxonomic data analysis.
- Citation: Farhana L, Antaki F, Murshed F, Mahmud H, Judd SL, Nangia-Makker P, Levi E, Yu Y, Majumdar AP. Gut microbiome profiling and colorectal cancer in African Americans and Caucasian Americans. World J Gastrointest Pathophysiol 2018; 9(2): 47-58
- URL: https://www.wjgnet.com/2150-5330/full/v9/i2/47.htm
- DOI: https://dx.doi.org/10.4291/wjgp.v9.i2.47