Copyright
©The Author(s) 2015.
World J Gastrointest Pathophysiol. Nov 15, 2015; 6(4): 140-149
Published online Nov 15, 2015. doi: 10.4291/wjgp.v6.i4.140
Published online Nov 15, 2015. doi: 10.4291/wjgp.v6.i4.140
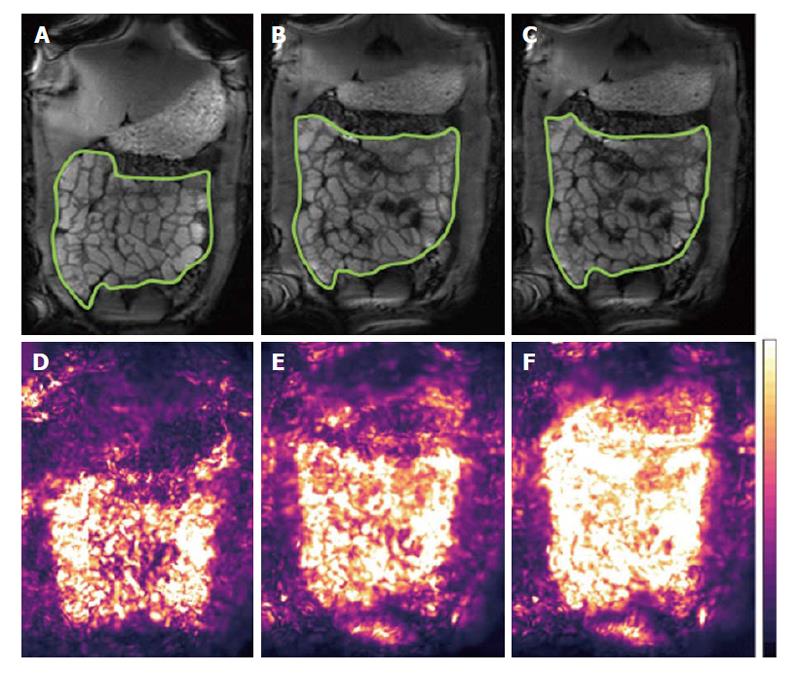
Figure 2 Small bowel motility maps.
Example of small bowel regions (contoured) in the upper panel and motility biomarker maps in the lower panel. Respectively: breath-hold ground truth (A and D), dual-registration of abdominal motion (B and E) and free breathing optical flow registration alone (C and F), respectively. Respiratory motion compensation is visible as reduced motility in the transverse colon closest to the diaphragm and systemically over the small bowel. The effect of robust data decomposition registration is less apparent in the lower bowel further from the diaphragm where the effects of free breathing are less pronounced. The color coding I the motility maps shows black as lower motility and white as higher. Reprinted with permission from ref. [28].
- Citation: Khalaf A, Hoad CL, Spiller RC, Gowland PA, Moran GW, Marciani L. Magnetic resonance imaging biomarkers of gastrointestinal motor function and fluid distribution. World J Gastrointest Pathophysiol 2015; 6(4): 140-149
- URL: https://www.wjgnet.com/2150-5330/full/v6/i4/140.htm
- DOI: https://dx.doi.org/10.4291/wjgp.v6.i4.140


