
















©The Author(s) 2025.
World J Gastrointest Pathophysiol. Sep 22, 2025; 16(3): 108058
Published online Sep 22, 2025. doi: 10.4291/wjgp.v16.i3.108058
Published online Sep 22, 2025. doi: 10.4291/wjgp.v16.i3.108058
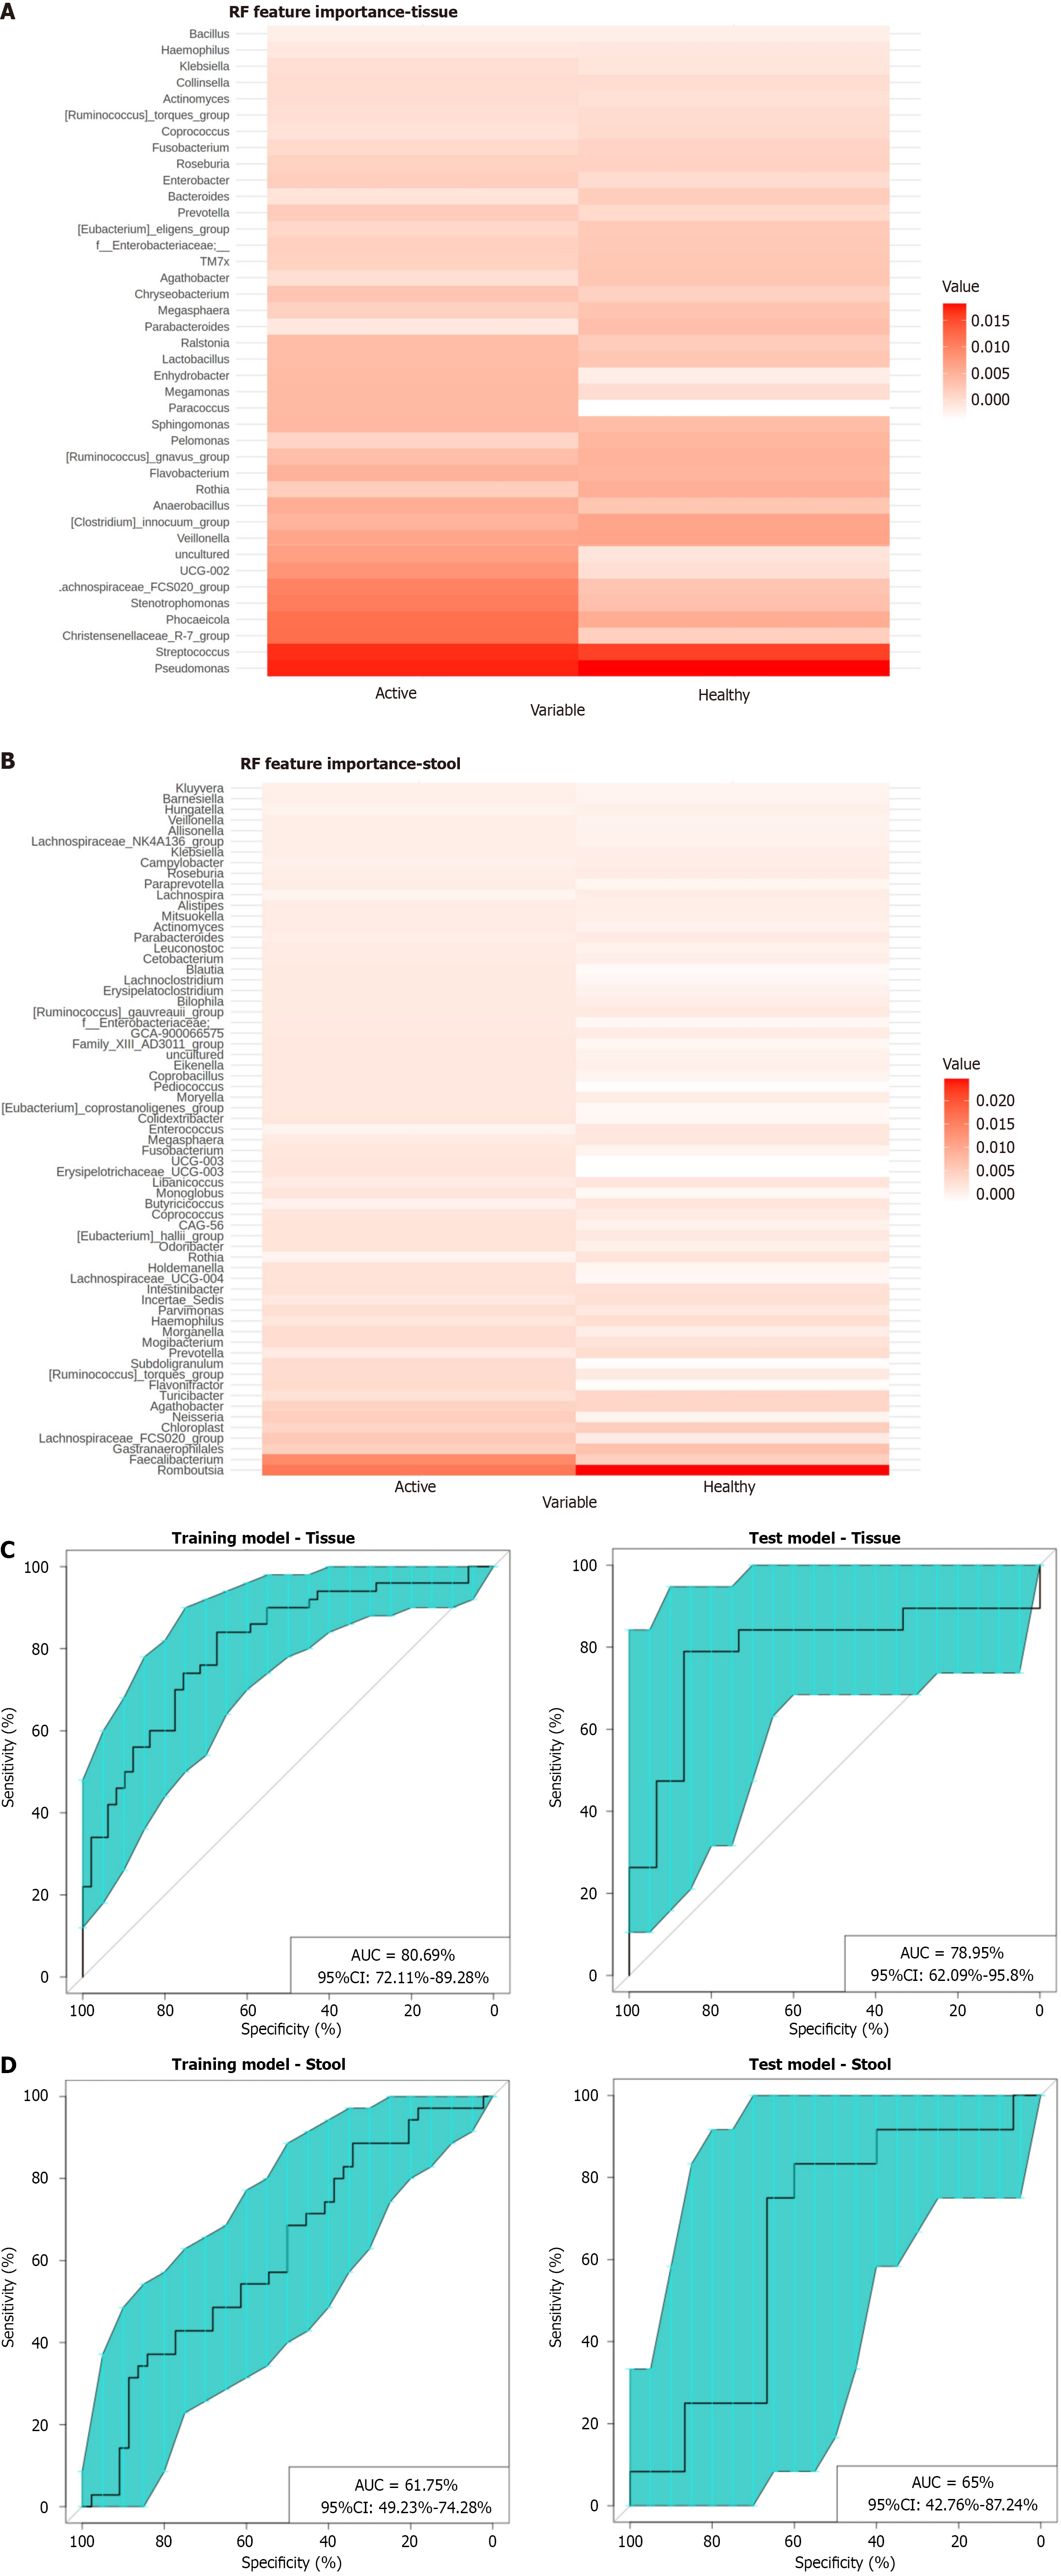
Figure 5 Bacterial predictors of disease state (active Crohn’s disease and healthy state) in tissue and stool samples.
A and B: Random forest analysis showing bacteria predicting active Crohn’s disease and healthy state in tissue sample and stool sample; C: Receiver operating characteristic curve showing ability of top 40 operational taxonomic units in tissue sample selected based on random forest analysis to discriminate between disease and healthy state; D: Receiver operating characteristic curve showing ability of top 65 operational taxonomic units in stool sample to discriminate between disease and healthy state. AUC: Area under curve; CI: Confidence interval.
- Citation: Dutta AK, Abraham D, Praharaj I, Benny B, Govindan K, Zondervenni Z, Joseph A. Dynamics of tissue and fecal microbiota in active Crohn’s disease and their ability to predict disease state. World J Gastrointest Pathophysiol 2025; 16(3): 108058
- URL: https://www.wjgnet.com/2150-5330/full/v16/i3/108058.htm
- DOI: https://dx.doi.org/10.4291/wjgp.v16.i3.108058