Copyright
©The Author(s) 2021.
World J Gastrointest Pathophysiol. May 22, 2021; 12(3): 40-50
Published online May 22, 2021. doi: 10.4291/wjgp.v12.i3.40
Published online May 22, 2021. doi: 10.4291/wjgp.v12.i3.40
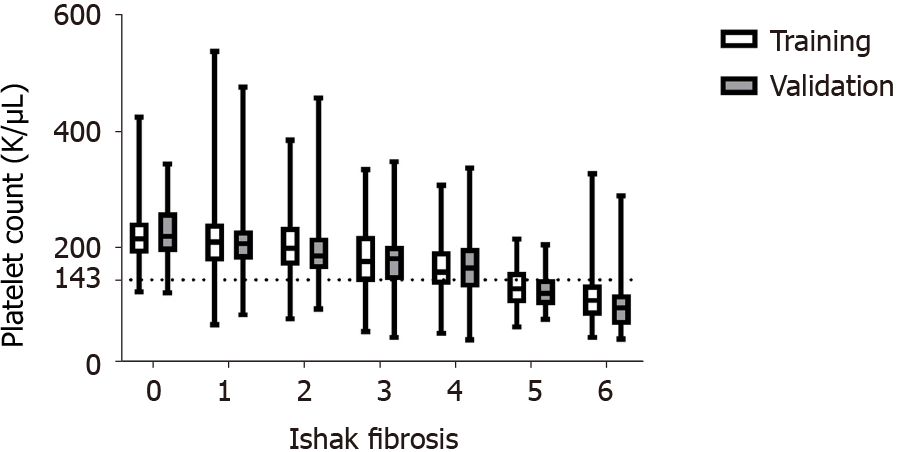
Figure 1 Platelet count distribution by Ishak fibrosis.
This figure displays the distribution of platelets in the training and validation cohorts by Ishak fibrosis. The dotted line indicates the calculated optimal platelet cut-off (143 × 109/L).
- Citation: Surana P, Hercun J, Takyar V, Kleiner DE, Heller T, Koh C. Platelet count as a screening tool for compensated cirrhosis in chronic viral hepatitis. World J Gastrointest Pathophysiol 2021; 12(3): 40-50
- URL: https://www.wjgnet.com/2150-5330/full/v12/i3/40.htm
- DOI: https://dx.doi.org/10.4291/wjgp.v12.i3.40


