Copyright
©The Author(s) 2016.
World J Gastrointest Pathophysiol. Feb 15, 2016; 7(1): 72-85
Published online Feb 15, 2016. doi: 10.4291/wjgp.v7.i1.72
Published online Feb 15, 2016. doi: 10.4291/wjgp.v7.i1.72
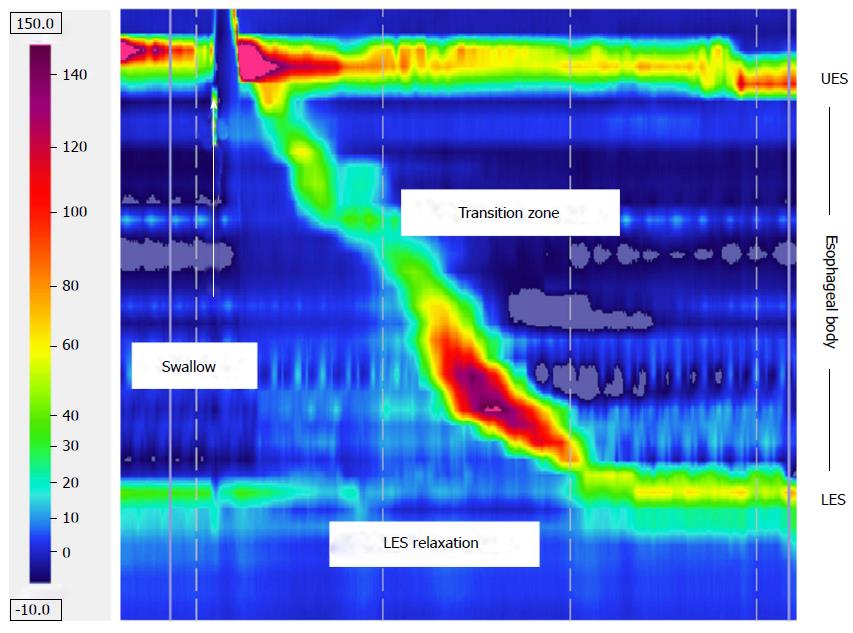
Figure 1 High resolution pressure topography of a peristaltic wave.
In the picture, both the upper and lower esophageal sphincters and swallowing-induced relaxation of the lower esophageal sphincter are well represented. UES: Upper esophageal sphincter; LES: Lower esophageal sphincter.
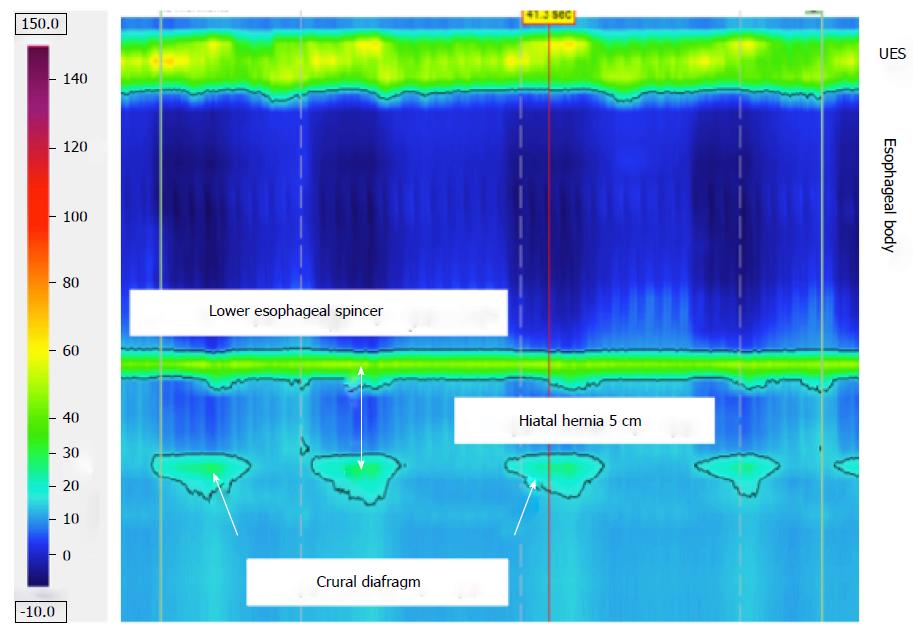
Figure 2 High resolution pressure topography at 30 s resting pressure calculation.
In the picture, both the upper and lower esophageal sphincters and the crural diaphragm are well represented. This picture represents a large hiatal hernia (5 cm). UES: Upper esophageal sphincter.
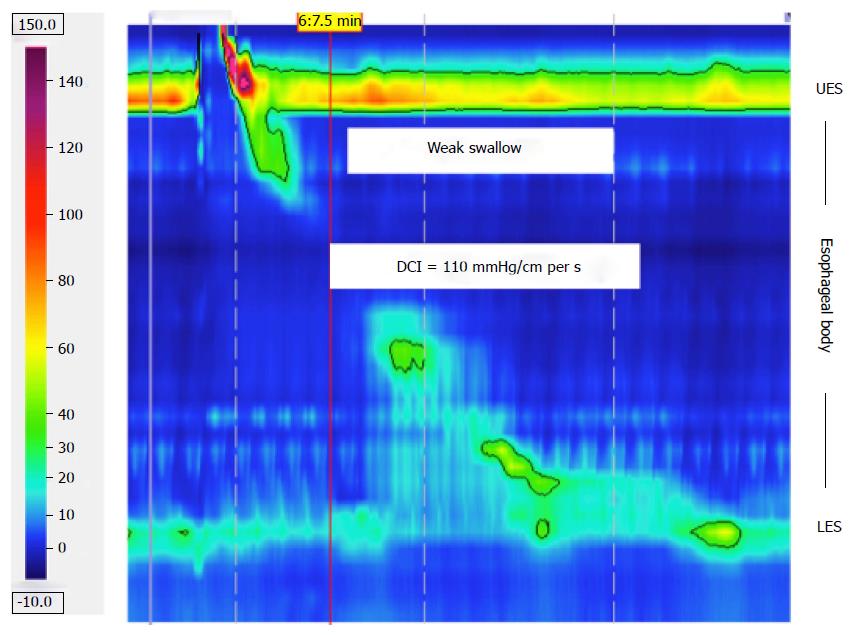
Figure 3 High resolution pressure topography of a weak peristaltic wave (distal contractile integral 110 mmHg-s-cm).
UES: Upper esophageal sphincter; LES: Lower esophageal sphincter; DCI: Distal contractile integral.
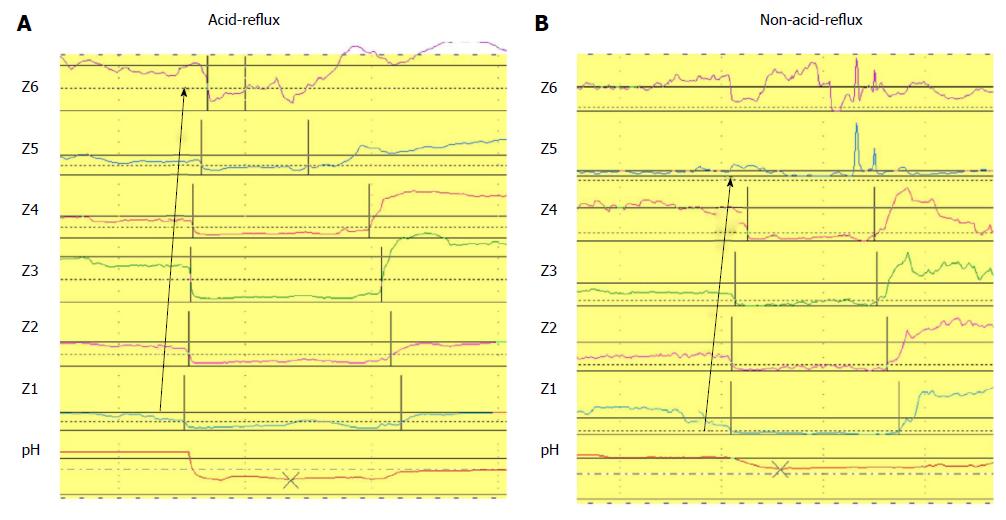
Figure 4 Graphic representation of MII-pH reflux events: (A) acid-proximal reflux; (B) non-acid distal reflux.
Z1-Z6: Impedance channel; pH: Channel for pH recording.
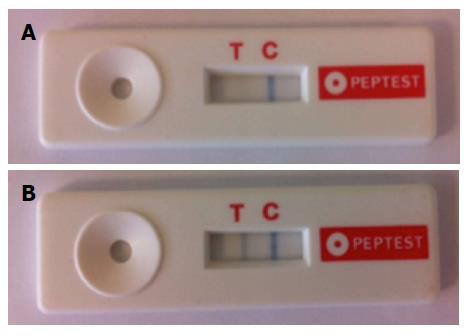
Figure 5 The picture shows the lateral flow device test to detect the presence of pepsin in saliva (PEP-test; RDBiomed, Hull, United Kingdom).
A: A negative test indicates that no pepsin was detected in clinical sample (only C line is colored); B: A positive test, it indicates that pepsin is present in the sample (saliva/sputum). In the both T and C line are colored.
- Citation: de Bortoli N, Martinucci I, Bertani L, Russo S, Franchi R, Furnari M, Tolone S, Bodini G, Bolognesi V, Bellini M, Savarino V, Marchi S, Savarino EV. Esophageal testing: What we have so far. World J Gastrointest Pathophysiol 2016; 7(1): 72-85
- URL: https://www.wjgnet.com/2150-5330/full/v7/i1/72.htm
- DOI: https://dx.doi.org/10.4291/wjgp.v7.i1.72


