Copyright
©The Author(s) 2017.
World J Radiol. Dec 28, 2017; 9(12): 416-425
Published online Dec 28, 2017. doi: 10.4329/wjr.v9.i12.416
Published online Dec 28, 2017. doi: 10.4329/wjr.v9.i12.416
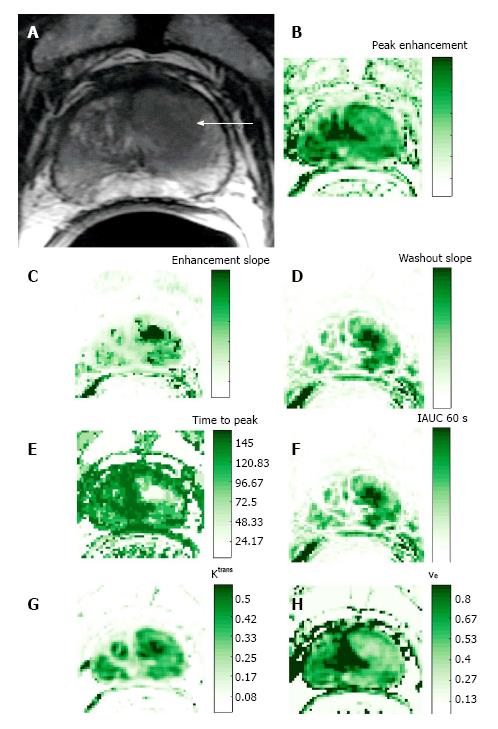
Figure 4 Representative 3T data in 63-year-old patient with prostate cancer (presurgical prostate-specific antigen level, 3.
4 ng/mL). A: Transverse T2-weighted image. Pharmacokinetic parameter maps based on the semi-quantitative method and the Toft’s kinetic model. Parametric maps for the semi-quantitative parameters, including; B: Peak-enhancement; C: Enhancement slope; D: Wash-out slope; E: Time-to-peak; and F: Intensity curve or contrast medium concentration at 60 s. Using the Toft’s kinetic model, the pharmacokinetic parameter maps for G Ktrans and H ve are shown.
- Citation: Mazaheri Y, Akin O, Hricak H. Dynamic contrast-enhanced magnetic resonance imaging of prostate cancer: A review of current methods and applications. World J Radiol 2017; 9(12): 416-425
- URL: https://www.wjgnet.com/1949-8470/full/v9/i12/416.htm
- DOI: https://dx.doi.org/10.4329/wjr.v9.i12.416


