Copyright
©The Author(s) 2016.
World J Radiol. Sep 28, 2016; 8(9): 764-774
Published online Sep 28, 2016. doi: 10.4329/wjr.v8.i9.764
Published online Sep 28, 2016. doi: 10.4329/wjr.v8.i9.764
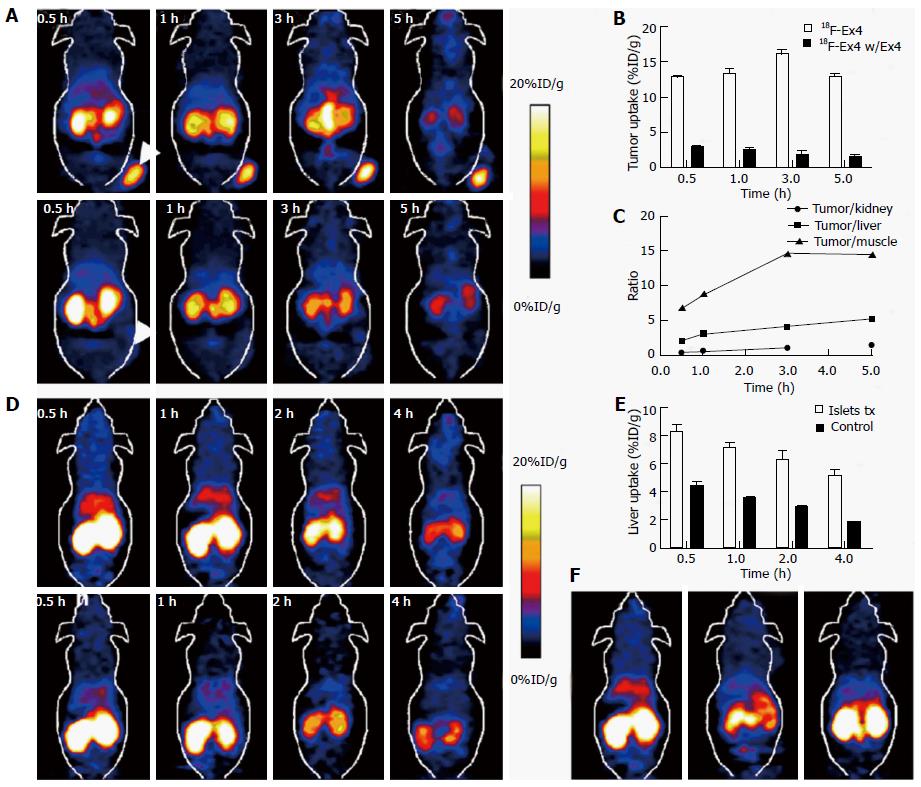
Figure 4 Representative 18F-TTCO-Cys40-exendin-4 positron emission tomography images in NOD/SCID mice.
A: Representative microPET images of 18F-TTCOCys40-exendin-4 (top) and blocking (bottom) for NOD/SCID mice with INS-1; B: Tumor uptakes between control and blocking groups; C: Tumor to organs ratios of radiotracer at different time points p.i.; D: Representative microPET images of tracer in NOD/SCID mice transplanted with human islets into liver (top) and control mice (bottom) at different time points p.i.; E: Liver uptake between intraportal islet transplantation and sham control groups; F: MicroPET mages of mice transplanted with human islets (Left: Control; Middle: Blocking and sham control mice at 1 h p.i.). Reprinted with permission from Ref.[23]. PET: Positron emission tomography.
- Citation: Li J, Karunananthan J, Pelham B, Kandeel F. Imaging pancreatic islet cells by positron emission tomography. World J Radiol 2016; 8(9): 764-774
- URL: https://www.wjgnet.com/1949-8470/full/v8/i9/764.htm
- DOI: https://dx.doi.org/10.4329/wjr.v8.i9.764


