Copyright
©The Author(s) 2016.
World J Radiol. May 28, 2016; 8(5): 434-448
Published online May 28, 2016. doi: 10.4329/wjr.v8.i5.434
Published online May 28, 2016. doi: 10.4329/wjr.v8.i5.434
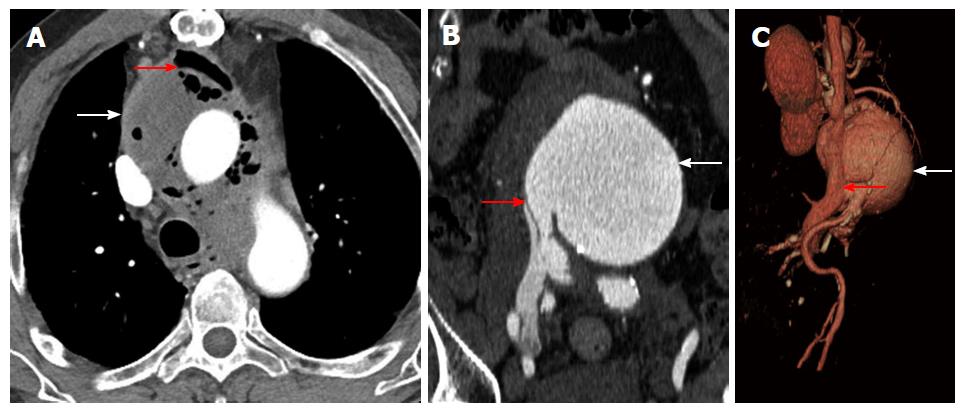
Figure 11 Fistula.
A: Aortoesophageal fistula-axial computed tomography (CT) scan shows multiple gas locules in the ascending aorta (arrows) consistent with aortoesophageal fistula; B: Coronal contrast enhanced CT shows a large abdominal aortic aneurysm (white arrow) near the level of the bifurcation communicating with the inferior vena cava (red arrow), which is isoattenuating to the aorta; C: Three-dimensional volume rendered CT shows abdominal aortic aneurysm (white arrow) with fistulous connection to the inferior vena cava (red arrow).
- Citation: Kalisz K, Rajiah P. Radiological features of uncommon aneurysms of the cardiovascular system. World J Radiol 2016; 8(5): 434-448
- URL: https://www.wjgnet.com/1949-8470/full/v8/i5/434.htm
- DOI: https://dx.doi.org/10.4329/wjr.v8.i5.434


