Copyright
©The Author(s) 2016.
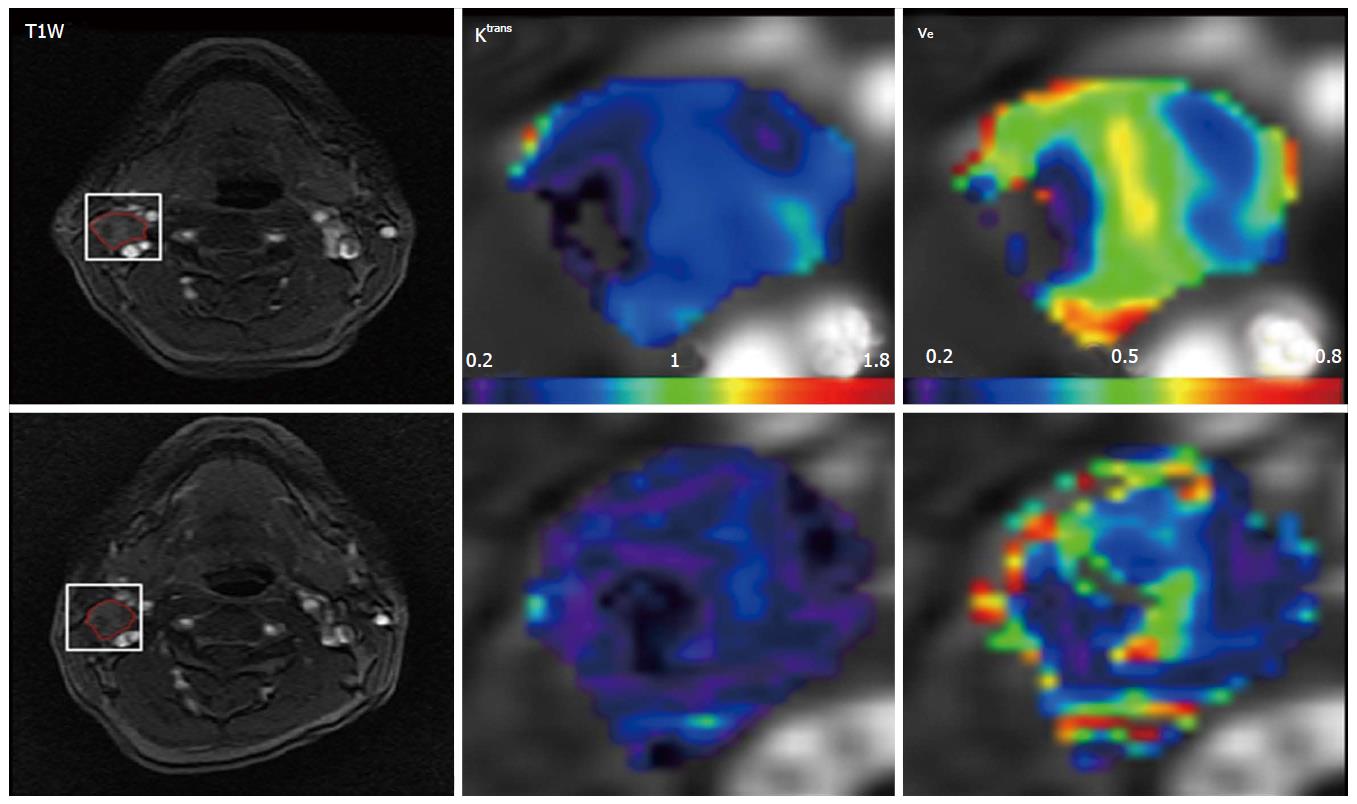
Figure 1 Pretreatment and intra-treatment dynamic contrast-enhanced magnetic resonance imaging images of patient with locoregional failure (male, 50 years).
The top row shows images of the Pre study, and the bottom row shows images from the Intra study. From left to right, the columns show a T1-weighted image, Ktrans (min-1) map, and ve map. The white rectangles delineate the ROIs at the metastatic nodes. Ktrans and ve maps are zoomed at the locations of ROIs. The corresponding texture measures for the Ktrans and Ve maps for pre and intra are: Ktrans:E (Pre: 0.25, Intra: 0.38), H (Pre: 0.81, Intra: 0.83), ve: E (Pre: 0.27, Intra: 0.70), H (Pre: 0.83, Intra: 0.90). Pre: Pretreatment; Intra: Intra-treatment; E: Energy; H: Homogeneity; ROIs: Regions of interest.
- Citation: Jansen JF, Lu Y, Gupta G, Lee NY, Stambuk HE, Mazaheri Y, Deasy JO, Shukla-Dave A. Texture analysis on parametric maps derived from dynamic contrast-enhanced magnetic resonance imaging in head and neck cancer. World J Radiol 2016; 8(1): 90-97
- URL: https://www.wjgnet.com/1949-8470/full/v8/i1/90.htm
- DOI: https://dx.doi.org/10.4329/wjr.v8.i1.90


