
















©The Author(s) 2016.
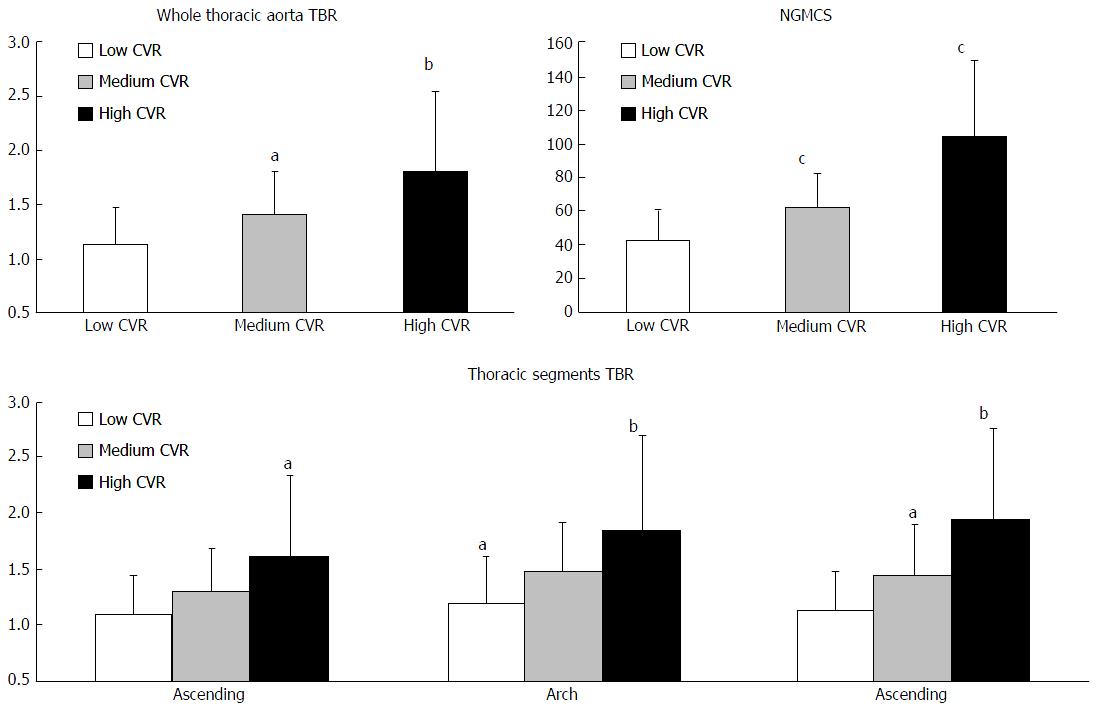
Figure 2 Target-to-background ratio differences in cardiovascular risk classes.
The figure highlights the average TBR values for the whole thoracic aorta (top left), the myocardium (top right) and the three different thoracic aorta segments (bottom). aP < 0.05; bP < 0.01; cP < 0.001. TBR: Target-to-background ratio; CVR: Cardiovascular risk; NGMCS: Normalized global molecular calcification score.
- Citation: Fiz F, Morbelli S, Bauckneht M, Piccardo A, Ferrarazzo G, Nieri A, Artom N, Cabria M, Marini C, Canepa M, Sambuceti G. Correlation between thoracic aorta 18F-natrium fluoride uptake and cardiovascular risk. World J Radiol 2016; 8(1): 82-89
- URL: https://www.wjgnet.com/1949-8470/full/v8/i1/82.htm
- DOI: https://dx.doi.org/10.4329/wjr.v8.i1.82