Copyright
©The Author(s) 2015.
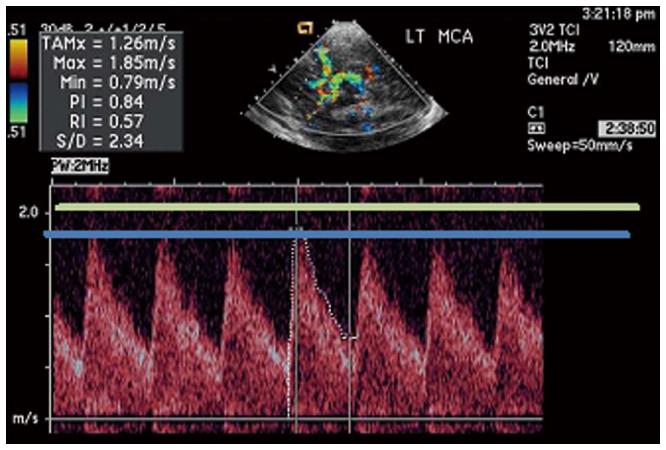
Figure 1 Example of time averaged mean maximum velocity measurement in the left middle cerebral artery.
The green line represents the cutoff for PSV (200 cm/s) which was considered conditional requiring increased surveillance. The blue line represents the cutoff for TAMV (170 cm/s) which was considered conditional requiring increased surveillance. This study did not result in a conditional interpretation by either criteria (TAMV = 126 cm/s and PSV = 185 cm/s). MCA: Middle cerebral artery; TAMV: Time average maximum mean velocity; PSV: Peak systolic velocity.
- Citation: Naffaa LN, Tandon YK, Irani N. Transcranial Doppler screening in sickle cell disease: The implications of using peak systolic criteria. World J Radiol 2015; 7(2): 52-56
- URL: https://www.wjgnet.com/1949-8470/full/v7/i2/52.htm
- DOI: https://dx.doi.org/10.4329/wjr.v7.i2.52


