Copyright
©The Author(s) 2015.
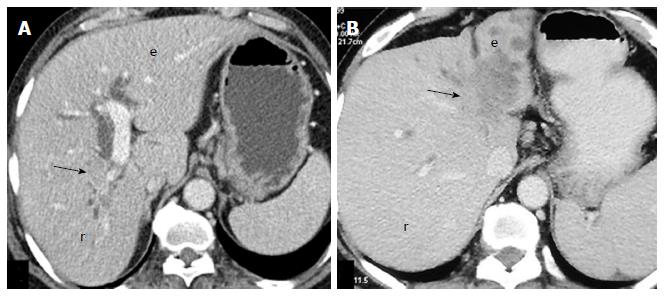
Figure 11 Axial computed tomography images showing atrophy of right lobe (r) due to hilar mass (arrow) in A, and atrophy of left lobe (l) caused by a mass (arrow) in B.
- Citation: Madhusudhan KS, Gamanagatti S, Gupta AK. Imaging and interventions in hilar cholangiocarcinoma: A review. World J Radiol 2015; 7(2): 28-44
- URL: https://www.wjgnet.com/1949-8470/full/v7/i2/28.htm
- DOI: https://dx.doi.org/10.4329/wjr.v7.i2.28


