Copyright
©The Author(s) 2015.
World J Radiol. Nov 28, 2015; 7(11): 405-414
Published online Nov 28, 2015. doi: 10.4329/wjr.v7.i11.405
Published online Nov 28, 2015. doi: 10.4329/wjr.v7.i11.405
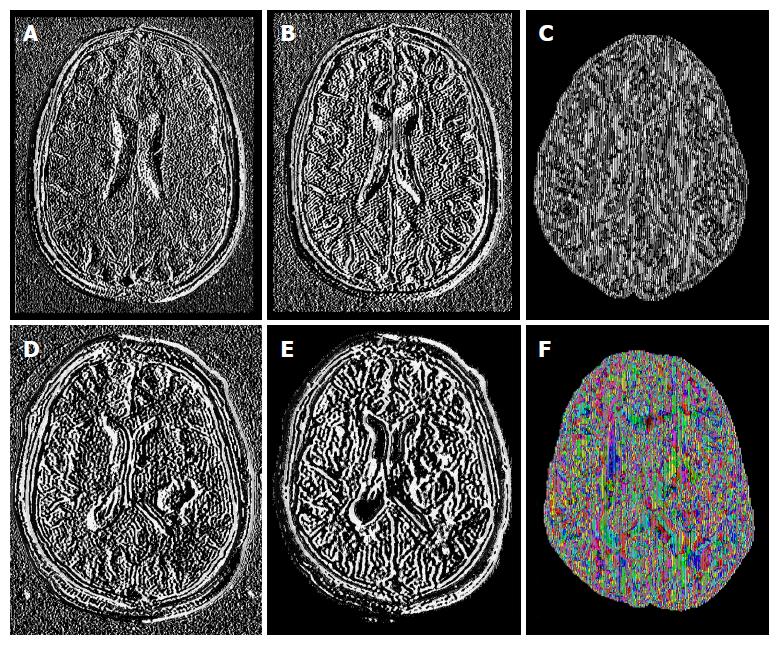
Figure 1 Example of some sequences and diffusion tensor imaging maps from healthy brains (upper row) and brains with glioblastoma multiforme (lower row): T1-postgadolinium images (A and D), Flair sequence (B and E); pure isotropic diffusion (C), color map of the V1-vector (F).
- Citation: Cortez-Conradis D, Rios C, Moreno-Jimenez S, Roldan-Valadez E. Partial correlation analyses of global diffusion tensor imaging-derived metrics in glioblastoma multiforme: Pilot study. World J Radiol 2015; 7(11): 405-414
- URL: https://www.wjgnet.com/1949-8470/full/v7/i11/405.htm
- DOI: https://dx.doi.org/10.4329/wjr.v7.i11.405


