Copyright
©The Author(s) 2015.
World J Radiol. Nov 28, 2015; 7(11): 361-374
Published online Nov 28, 2015. doi: 10.4329/wjr.v7.i11.361
Published online Nov 28, 2015. doi: 10.4329/wjr.v7.i11.361
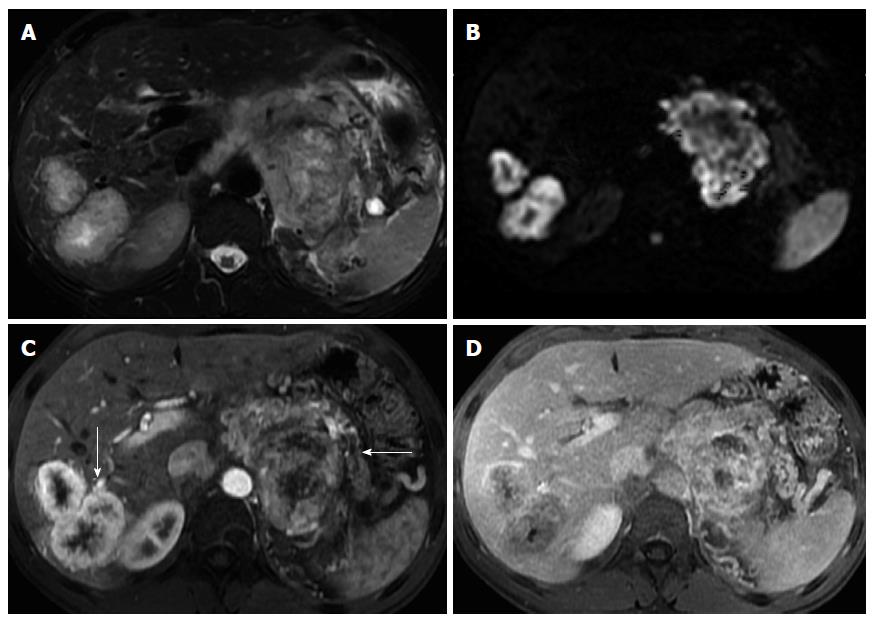
Figure 8 Pancreatic neuroendocrine tumor and liver metastases.
Axial T2-weighted SS-ETSE (A), diffusion weighted images (b = 500) (B) and post-gadolinium fat-suppressed T1-weighted GRE images acquired in the arterial (C) and venous (D) phase of enhancement. A large mass is seen arising in the body and tail of the pancreas, showing moderate signal intensity on T2-weighted images (A) and restriction to diffusion (B). This lesion shows hypervascular characteristics (C). This mass was diagnosed as poorly differentiated neuroendocrine tumor. Note that the liver metastases show similar signal characteristics on T2- and diffusion-weighted images and demonstrate the characteristic arterial wash-in (arrow, C) and late washout (D) seen with neuroendocrine tumor metastases. SS-ETSE: Single-shot echo train spin echo; GRE: Gradient echo.
- Citation: Al Ansari N, Ramalho M, Semelka RC, Buonocore V, Gigli S, Maccioni F. Role of magnetic resonance imaging in the detection and characterization of solid pancreatic nodules: An update. World J Radiol 2015; 7(11): 361-374
- URL: https://www.wjgnet.com/1949-8470/full/v7/i11/361.htm
- DOI: https://dx.doi.org/10.4329/wjr.v7.i11.361


