Copyright
©2014 Baishideng Publishing Group Inc.
World J Radiol. Aug 28, 2014; 6(8): 598-606
Published online Aug 28, 2014. doi: 10.4329/wjr.v6.i8.598
Published online Aug 28, 2014. doi: 10.4329/wjr.v6.i8.598
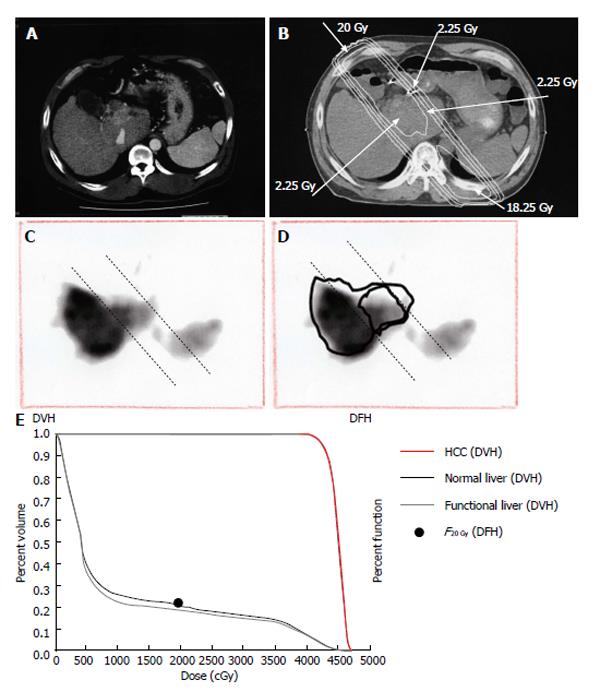
Figure 8 Quantitative analysis of radiation-induced dysfunctional liver.
A: Computed tomographic image of a 52-year-old man with a recurrent tumor thrombus in the main portal vein after undergoing left hepatectomy for hepatocellular carcinoma; B: Isodose curves used for treatment planning; C: F20Gy was calculated from the GSA count of the entire liver and the area within the 20 Gy isodose curve; D: F20 Gy was calculated from a single photon emission computed tomography with Tc-99m-galactosyl human serum albumin image using the formula: F20 Gy = 100 × (GSA count in the area of the liver within the 20 Gy isodose curve)/(GSA count for the entire liver); E: In this patient, F20Gy was 22.2%. GSA: Galactosyl human serum albumin; DVH: Dose volume histogram; DFH: Dose function histogram; HCC: Hepatocellular carcinoma.
- Citation: Shirai S, Sato M, Noda Y, Kumayama Y, Shimizu N. Incorporating GSA-SPECT into CT-based dose-volume histograms for advanced hepatocellular carcinoma radiotherapy. World J Radiol 2014; 6(8): 598-606
- URL: https://www.wjgnet.com/1949-8470/full/v6/i8/598.htm
- DOI: https://dx.doi.org/10.4329/wjr.v6.i8.598


