Copyright
©2014 Baishideng Publishing Group Inc.
World J Radiol. May 28, 2014; 6(5): 130-138
Published online May 28, 2014. doi: 10.4329/wjr.v6.i5.130
Published online May 28, 2014. doi: 10.4329/wjr.v6.i5.130
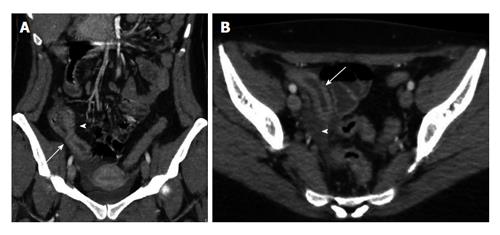
Figure 3 Crohn’s disease.
A: Computed tomography (CT) coronal reconstruction shows terminal ileal loop thickening with white attenuation pattern (arrow) and perivisceral vasa recta (arrowhead); B: Transverse CT scan shows thickening of the terminal ileal loop (arrow) associated with perivisceral endoperitoneal fluid (arrowhead).
- Citation: Moschetta M, Telegrafo M, Rella L, Stabile Ianora AA, Angelelli G. Multi-detector CT features of acute intestinal ischemia and their prognostic correlations. World J Radiol 2014; 6(5): 130-138
- URL: https://www.wjgnet.com/1949-8470/full/v6/i5/130.htm
- DOI: https://dx.doi.org/10.4329/wjr.v6.i5.130


