Copyright
©2013 Baishideng Publishing Group Co.
World J Radiol. Aug 28, 2013; 5(8): 295-303
Published online Aug 28, 2013. doi: 10.4329/wjr.v5.i8.295
Published online Aug 28, 2013. doi: 10.4329/wjr.v5.i8.295
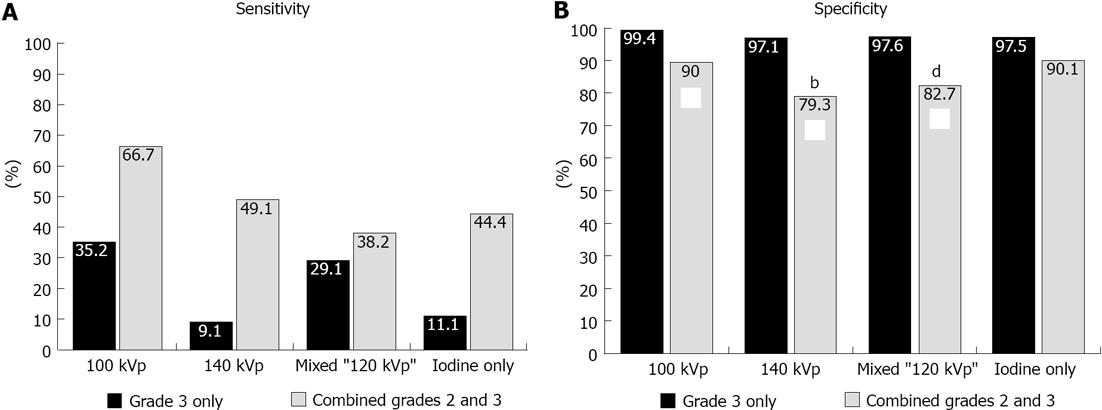
Figure 3 Comparison of sensitivity measurements obtained for low, high, and mixed tube energy voltages.
A: There were significant differences noted between the following pairs using grade 3 only: 100 kVp vs 140 kVp (P < 0.05); 100 kVp vs iodine only (P < 0.05); 140 kVp vs mixed (P < 0.05), and between the following pairs using combined grade 2 and grade 3: 100 kVp vs 140 kVp (P < 0.0005); 100 kVp vs mixed (P < 0.0001); 100 kVp vs iodine only (P < 0.005); B: No significant differences were noted except between the following pairs using combined grades 2 and 3: 100 kVp vs 140 kVp (bP < 0.01); 100 kVp vs mixed (dP < 0.01).
- Citation: Srichai MB, Chandarana H, Donnino R, Lim IIP, Leidecker C, Babb J, Jacobs JE. Diagnostic accuracy of cardiac computed tomography angiography for myocardial infarction. World J Radiol 2013; 5(8): 295-303
- URL: https://www.wjgnet.com/1949-8470/full/v5/i8/295.htm
- DOI: https://dx.doi.org/10.4329/wjr.v5.i8.295


