Copyright
©2013 Baishideng Publishing Group Co.
World J Radiol. Dec 28, 2013; 5(12): 472-483
Published online Dec 28, 2013. doi: 10.4329/wjr.v5.i12.472
Published online Dec 28, 2013. doi: 10.4329/wjr.v5.i12.472
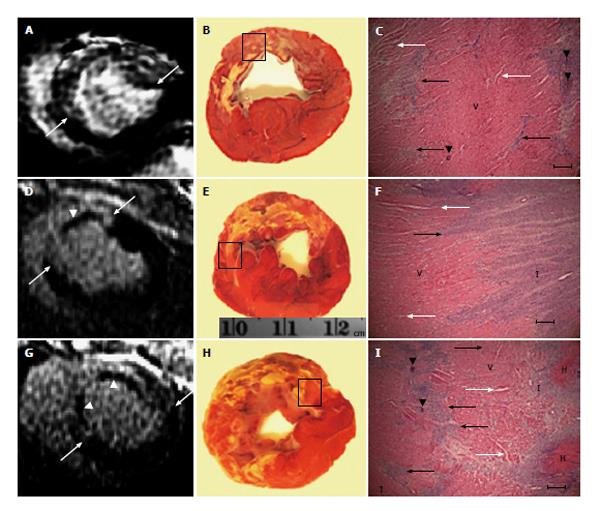
Figure 6 Viability contrast enhanced magnetic resonance images postmortem histochemical triphenyltetrazolium chloride stain and microscopy in animals subjected to soley microinfarction (top), soley location aid device occlusion/reperfusion (middle) and combined location aid device occlusion/reperfusion and microembolization (bottom).
A: MR image and TTC stain show patchy microinfarct in the LAD territory; B: Postmortem histochemical TTC stain; C: Shows necrotic small islands (black arrows), interstitial edema (white arrow) and microemboli (black arrowhead); D: MR image shows the large infarct (white arrows) with hypoenhanced microvascular obstruction zone (white arrowhead); E: TTC section shows transmural infarct; F: Microinfarct tethering (black arrows) and interstial edema (white arrows) at the edge of the infarct; G: MR image shows the large infarct with patchy hyperenhanced microinfarct in the peri-infarct region (white arrows) with very large hypoenhanced microvascular obstruction zones (white arrowhead); H: TTC section shows hemorrhagic transmural infarct with patchy microinfarct in the peri-infarct region; I: Necrotic small islands (black arrows), interstitial edema (white arrow) and microemboli (black arrowhead). V: Viable myocardium, H: Hemorrhage; I: Large infarct. TTC: Triphenyltetrazolium chloride; MRI: Magnetic resonance imaging; LAD: Location aid device.
- Citation: Suhail MS, Wilson MW, Hetts SW, Saeed M. Magnetic resonance imaging characterization of circumferential and longitudinal strain under various coronary interventions in swine. World J Radiol 2013; 5(12): 472-483
- URL: https://www.wjgnet.com/1949-8470/full/v5/i12/472.htm
- DOI: https://dx.doi.org/10.4329/wjr.v5.i12.472


