Copyright
©2013 Baishideng Publishing Group Co.
World J Radiol. Dec 28, 2013; 5(12): 472-483
Published online Dec 28, 2013. doi: 10.4329/wjr.v5.i12.472
Published online Dec 28, 2013. doi: 10.4329/wjr.v5.i12.472
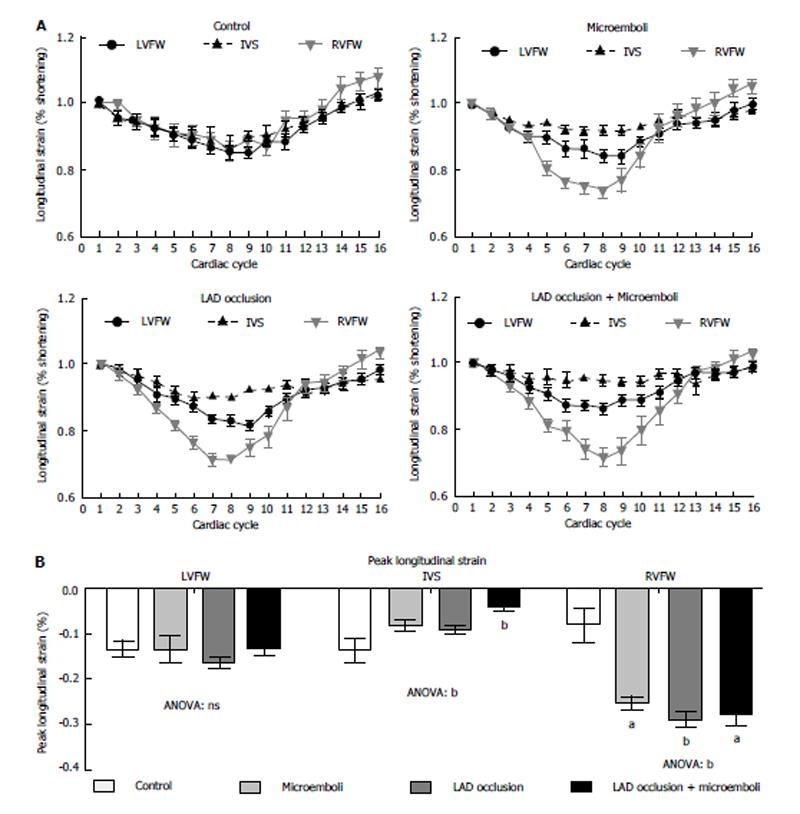
Figure 5 Longitudinal strain analysis: phasic and peak.
A: Phasic longitudinal strain rate curves quantitatively show increased strain in right ventricular free wall (RVFW) and decreased strain in interventricular septum (IVS); B: Peak longitudinal strain. All interventions showed compensatory increase in peak strain in RVFW, while significantly decreased longitudinal peak strain was only seen in the IVS of combined insult animals. Data are presented as means ± SEM. Control vs Microemboli, aP < 0.05; Control vs LAD Occlusion, bP < 0.01. LAD: Location aid device; LVFW: Left ventricular free wall.
- Citation: Suhail MS, Wilson MW, Hetts SW, Saeed M. Magnetic resonance imaging characterization of circumferential and longitudinal strain under various coronary interventions in swine. World J Radiol 2013; 5(12): 472-483
- URL: https://www.wjgnet.com/1949-8470/full/v5/i12/472.htm
- DOI: https://dx.doi.org/10.4329/wjr.v5.i12.472


