Copyright
©2013 Baishideng Publishing Group Co.
World J Radiol. Dec 28, 2013; 5(12): 472-483
Published online Dec 28, 2013. doi: 10.4329/wjr.v5.i12.472
Published online Dec 28, 2013. doi: 10.4329/wjr.v5.i12.472
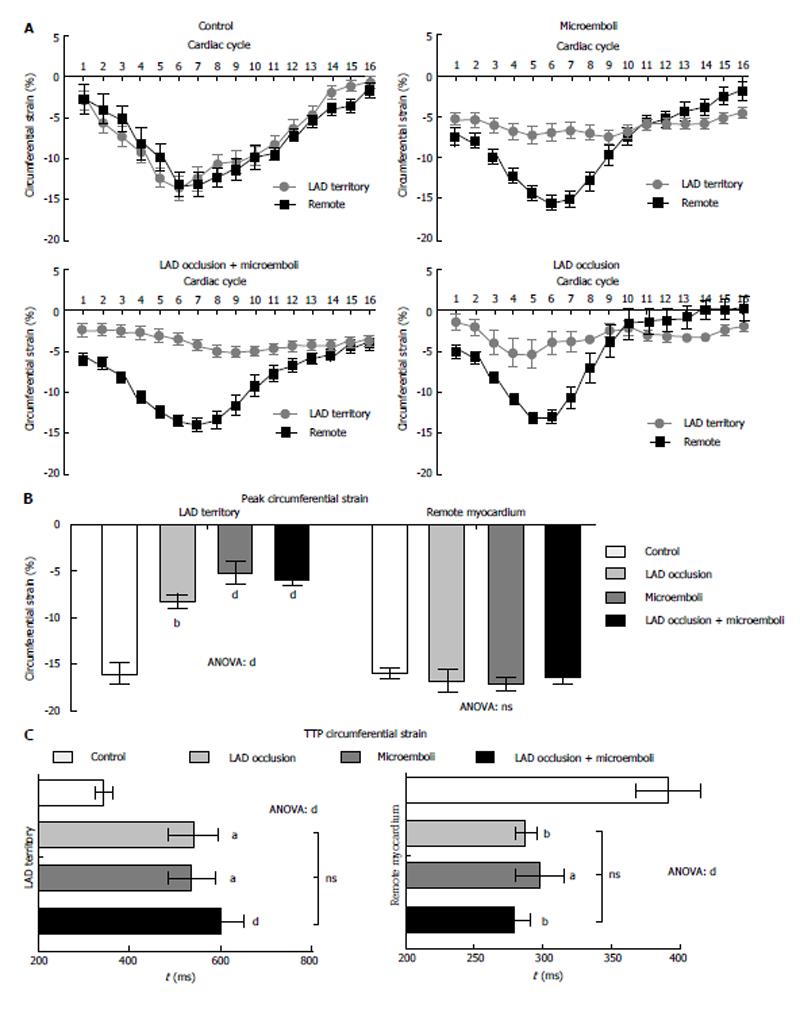
Figure 2 Circumferential strain analysis: phasic, peak, and territory time to peak strain.
A: Phasic circumferential strain peak and rate during one R-R interval in LAD territory and remote myocardium of the 4 groups. Data are presented as means ± SEM. A significantly decreased peak circumferential strain was observed in the LAD territory compared with remote myocardium in all coronary interventions (P < 0.001); B: Bars show average peak circumferential strain. ANOVA showed significant decrease in strain of the LAD territory 3 d after interventions compared with controls. Remote myocardium showed no significant difference between interventions and control; C: shows significant variation in time to peak circumferential strain between remote and the LAD territory time to peak strain (TTPS). Remote myocardium showed decreased TTPS for all interventions, while the LAD territory demonstrated increased TTPS. Control vs LAD, aP < 0.05; Control vs Microemboli, bP < 0.01; Control vs ANOVA dP < 0.001. LAD: Location aid device.
- Citation: Suhail MS, Wilson MW, Hetts SW, Saeed M. Magnetic resonance imaging characterization of circumferential and longitudinal strain under various coronary interventions in swine. World J Radiol 2013; 5(12): 472-483
- URL: https://www.wjgnet.com/1949-8470/full/v5/i12/472.htm
- DOI: https://dx.doi.org/10.4329/wjr.v5.i12.472


