Copyright
©2012 Baishideng Publishing Group Co.
World J Radiol. Aug 28, 2012; 4(8): 345-352
Published online Aug 28, 2012. doi: 10.4329/wjr.v4.i8.345
Published online Aug 28, 2012. doi: 10.4329/wjr.v4.i8.345
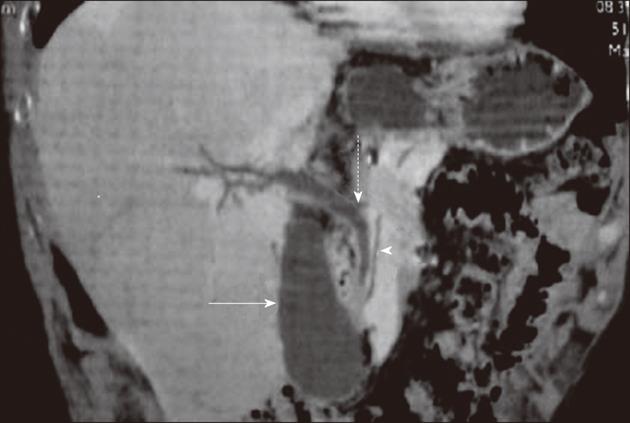
Figure 4 Computed tomography cholangiopancreatography utilizing minimum intensity projection.
The common bile duct (dash arrow), the pancreatic duct (arrowhead), and the gallbladder (solid arrow) are visualized and are normal in appearance.
- Citation: Ganeshan D, Moron FE, Szklaruk J. Extrahepatic biliary cancer: New staging classification. World J Radiol 2012; 4(8): 345-352
- URL: https://www.wjgnet.com/1949-8470/full/v4/i8/345.htm
- DOI: https://dx.doi.org/10.4329/wjr.v4.i8.345


