Copyright
©2012 Baishideng Publishing Group Co.
World J Radiol. Jul 28, 2012; 4(7): 328-334
Published online Jul 28, 2012. doi: 10.4329/wjr.v4.i7.328
Published online Jul 28, 2012. doi: 10.4329/wjr.v4.i7.328
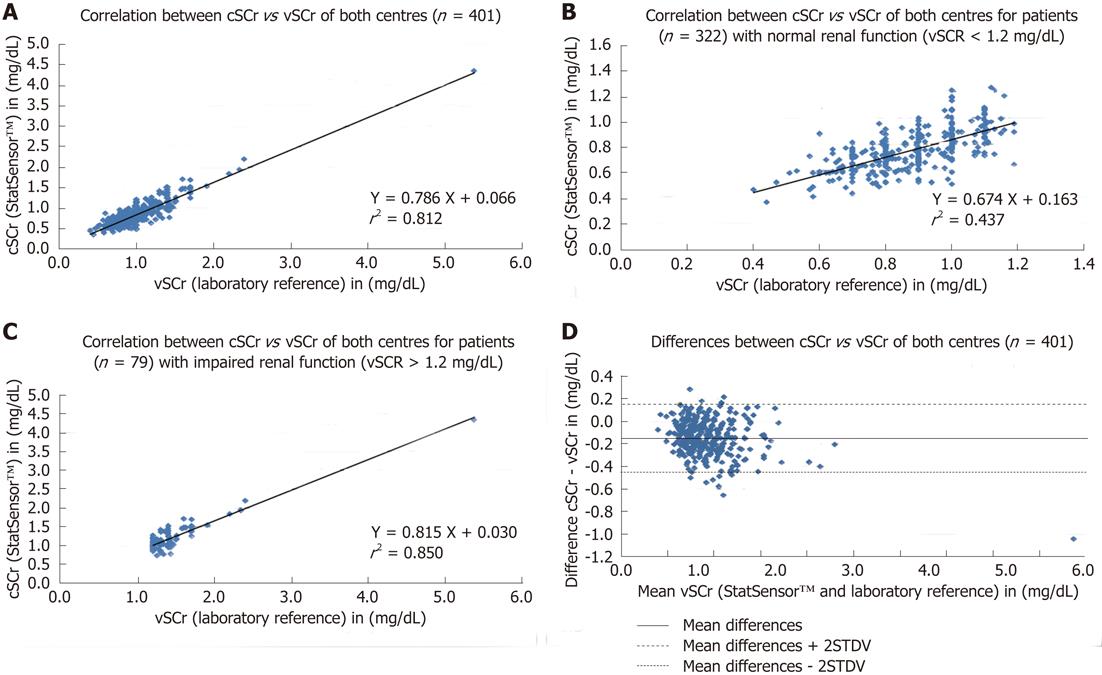
Figure 1 Scatter plots, regression equations and correlation coefficients for the correlation for capillary point-of-care serum creatinine vs venous point-of-care serum creatinine for both centres (A), for creatinine values below (B) and above (C) the cut-off-level of 1.
2 mg/dL (venous point-of-care serum creatinine). The Bland-Altman plot for the differences between capillary point-of-care serum creatinine (cSCr) and venous point-of-care serum creatinine (vSCr) for both centres (D).
- Citation: Haneder S, Gutfleisch A, Meier C, Brade J, Hannak D, Schoenberg SO, Becker CR, Michaely HJ. Evaluation of a handheld creatinine measurement device for real-time determination of serum creatinine in radiology departments. World J Radiol 2012; 4(7): 328-334
- URL: https://www.wjgnet.com/1949-8470/full/v4/i7/328.htm
- DOI: https://dx.doi.org/10.4329/wjr.v4.i7.328


